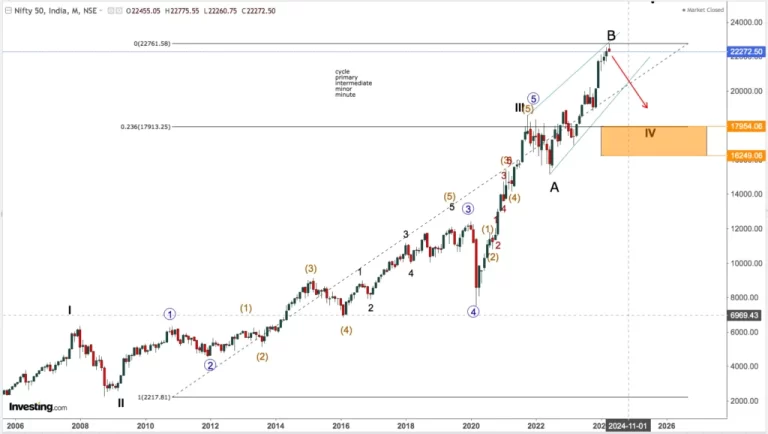
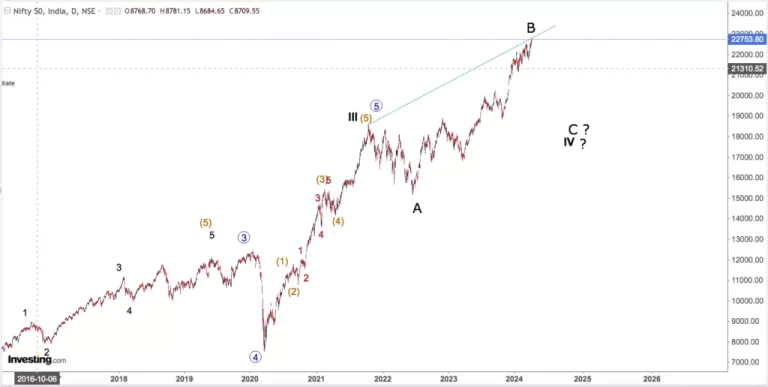
Nifty – The INCIDENT of iran israel war and the POSSIBLE FLAT in the making is very noteworthy, In the flat , if considered a running one , minimum correction till the orange rectangle, However...
NIFTY Opening On 12th April 2024 SECTOR WATCH NIFTY NIFTY PHARMA NIFTY PHARMA-CIPLA NIFTY OIL AND GAS NIFTY OIL AND GAS-BPCL NIFTY OIL AND GAS – ONGC NIFTY IT – NIFTY IT- HCL TEC NIFTY IT...
NIFTY PHARMA NIFTY PHARMA NIFTY OIL AND GAS NIFTY OIL AND GAS-ONGC NIFTY OIL AND GAS-ONGC NIFTY OIL AND GAS -GAIL NIFTY OIL AND GAS-GAIL NIFTY OIL AND GAS -BPCL NIFTY OIL ND GAS -BPCL NIFTY IT- NIFTY...
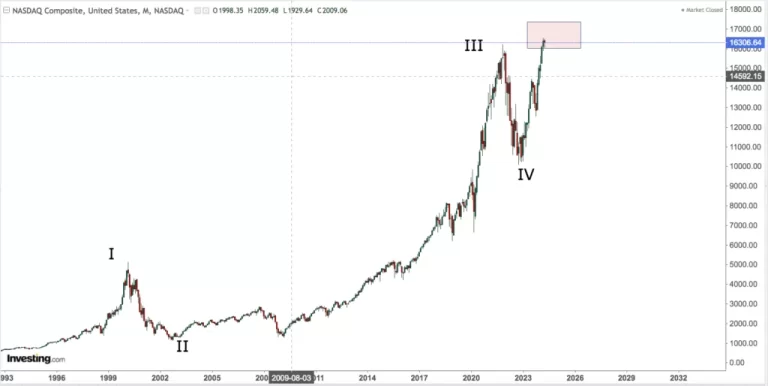
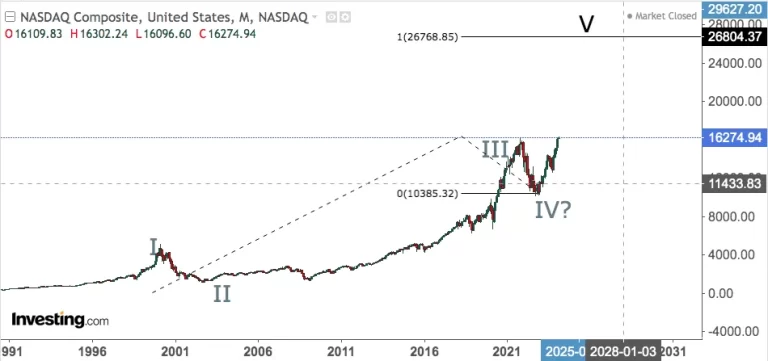
NASDAQ Opening On 10th April I have given three possibilities on the NASDAQ. Multiple possibilities always arise at every nodal point. POSSIBILITY ONEHere we have wave IV (cycle wave ) completed and...
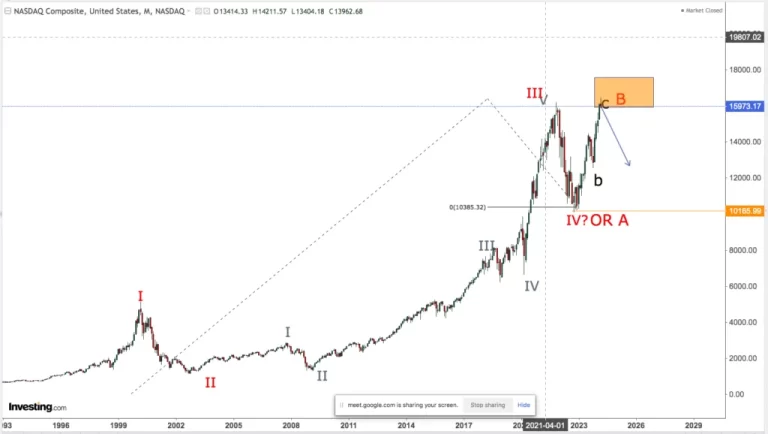
NASDAQ CLOSE UP APPLE MONTHLY APPLE ZOOMED IN MICROSOFT LONG TERM MICROSOFT ZOOMED IN NVIDIA SHOPIFY SHOPIFY ZOOMED IN PLEASE READ THE DISCLAIMER IN FOOTNOTE WHICH COVERS ALL ANALYSIS GIVEN IN THIS...
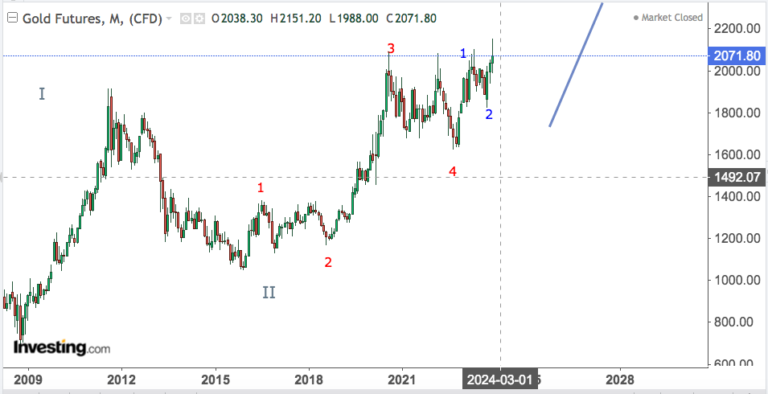
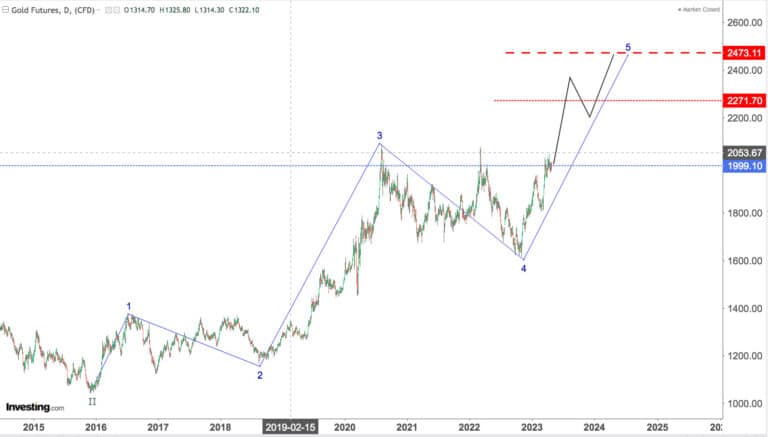
Gold , as stated earlier is on a bull run (notwithstanding intermittent corrections). As per above count we have the wave 5 probably extending , as indicated by the subwaves. We should see a healthy...
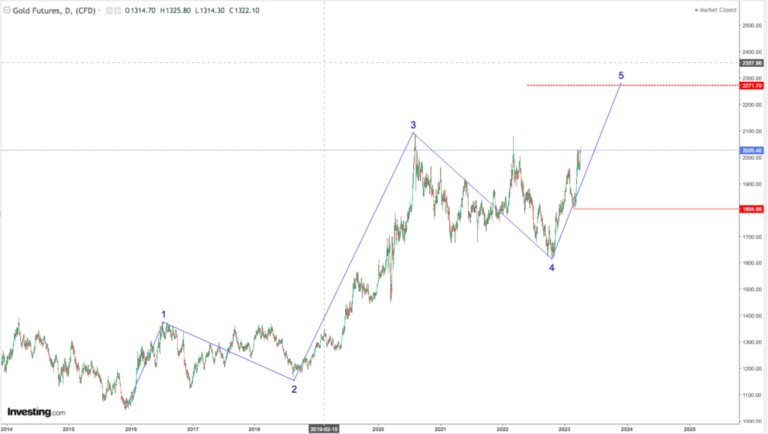
Gold May have finished its correction into wave 4 or we may be still into wave 4 and correct it as a double zigzag. Above I have given an image for completing its correction at wave 4. Gold is often...

Elliott Wave theory is known to have a subjective aspect to it, which can make it challenging, especially for novice traders. Having a mentor is a must , who through his experience can guide and give...
Technical Analysis can be broadly divided into two categories, “Trend and momentum following indicators”“Predicting with repeated patterns (Elliot Wave )”The 1st one has a huge...
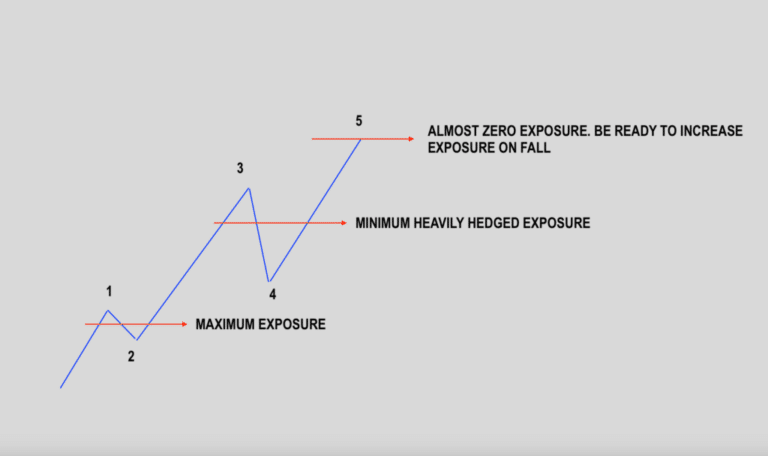
Trading in Stock markets, especially with derivatives has inherent risks. These risks can be mitigated by careful planning with the “Size Of Trade” and where one perceives the market to be...