This is a question answer to which will be always debatable as the investors will always have different temperaments and different requirements.
A long term investor does not believe in taking out his investments come what may. IN THE LONG RUN he will win of course if his investments are made in good value stocks. (Markets are always upward graded in a slight slope in the long term. ). A long term investor does not have a stoploss. However if you are plus 60 , you may not like to see even medium term losses let alone the short term.
A medium term investor is defined as someone who keeps his investments for no more than 1 month at any given time). He may or may not use the technical analysis . He sees a profit and cops out part or in full . He will wait for next big opportunity and then invest again at lower prices.
A short term trader is the one who is most likely using some form of technical analysis tools and basically is a intraday trader. He has his own sets of rules to buy and sell. The fact remains that 90 percent of the short term traders lose money eventually.(BUT THE 10 PERCENT WINNERS TAKE IT ALL)
So there is no CORRECT fixed point where one makes a calculation and squares up his position.
However one thing is for sure . Once a long term downtrend is confirmed , and this confirmation one knows early in the downtrend , one can take a learned decision AND according to his temperament.
Elliot wave does give this opportunity. However one needs to be very adept and flexible when using this great tool.
You will find below information helpful and informative
Elliot wave theory is all about herd mentality. It is surmised that the reactions in a large mass of people to any given situation are according to laws of nature and there is no individual will in a crowd reaction. There are alternate bouts of euphoria and depression in a crowd and this applies to all situations connected to life in general.
Since the stock market has millions of people investing AND reacting, elliot wave herd mentality rules apply in the markets as well. Every rise in the markets can be taken as an act of euphoria and a downturn as a depression. These alternate waves of euphoria and depression can be , according to elliot , measured and put down on paper and follow a certain fixed set of rules. The interesting part in this is, that the FINAL bout of depression, where a MAJOR wave turns down in the markets, is according to elliot, also the point of world wide conflict.(World wars, social unrest etc)
Before i get into the wave theory , it is also interesting to note that a stock market wave can even go higher even during depressive stages when there is acute fear of being left behind.(acute fear always is part of depression)
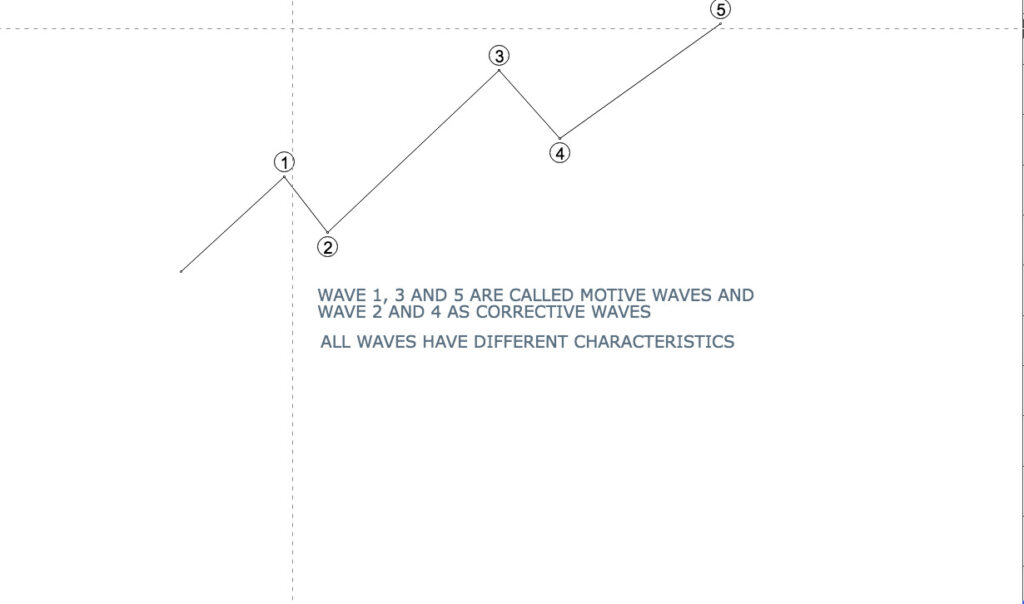
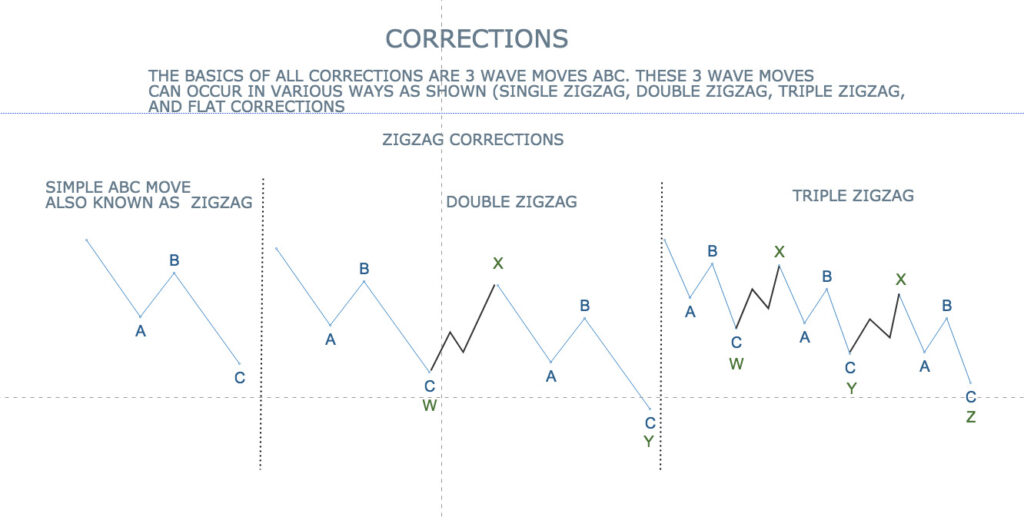
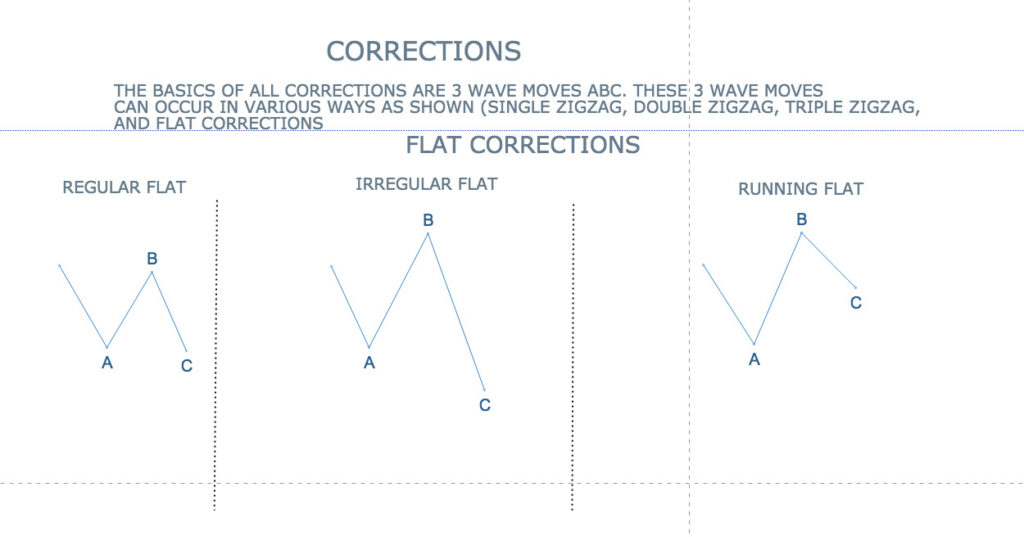
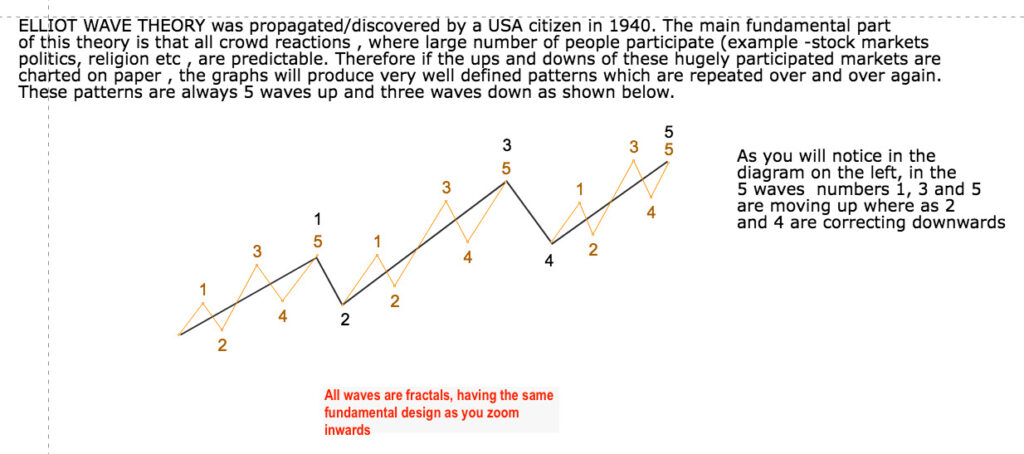
Now for the wave theory. In simple terms elliot theory can be surmised by two graphic diagrams given below given below.
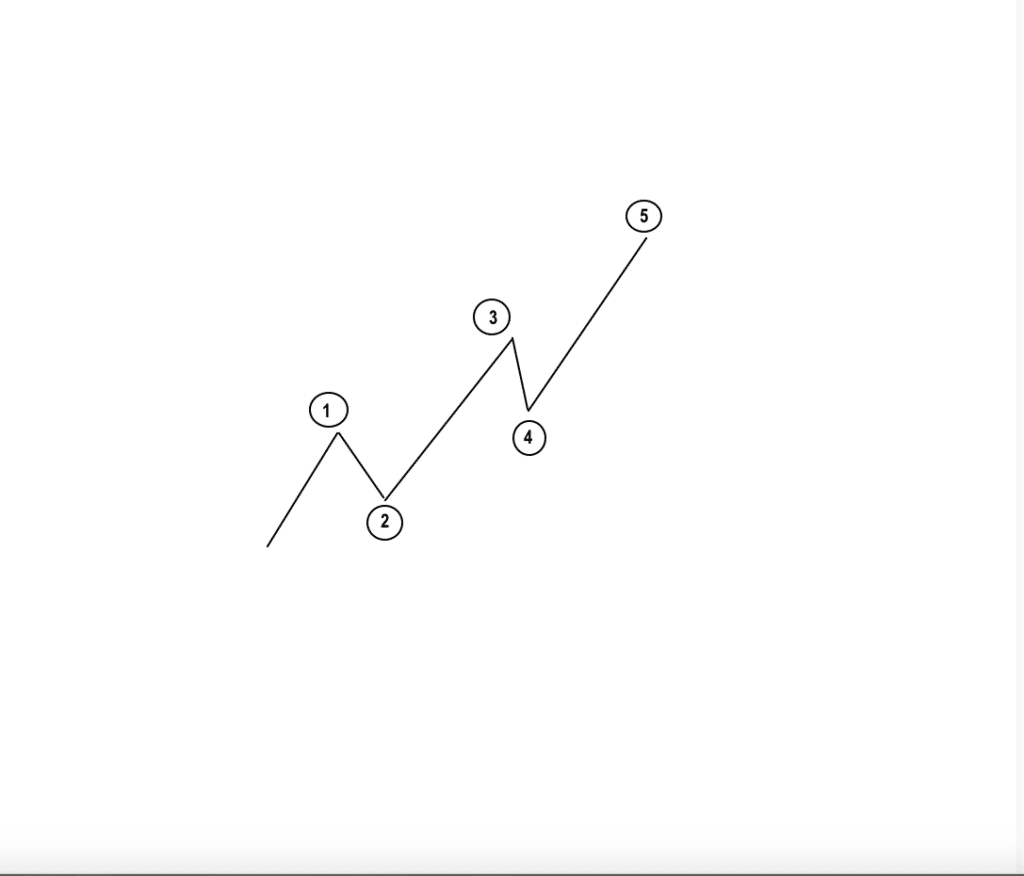
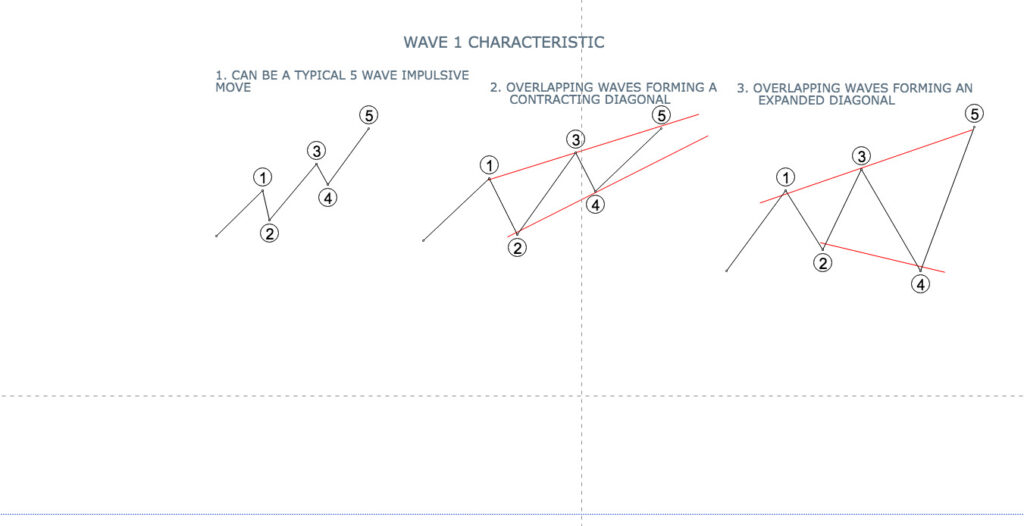
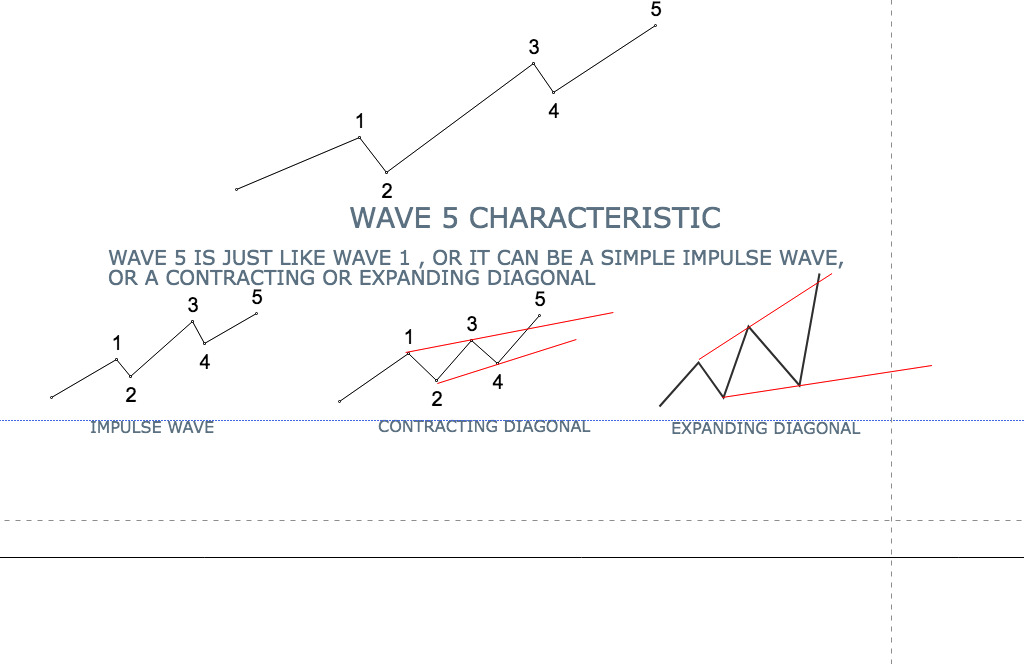
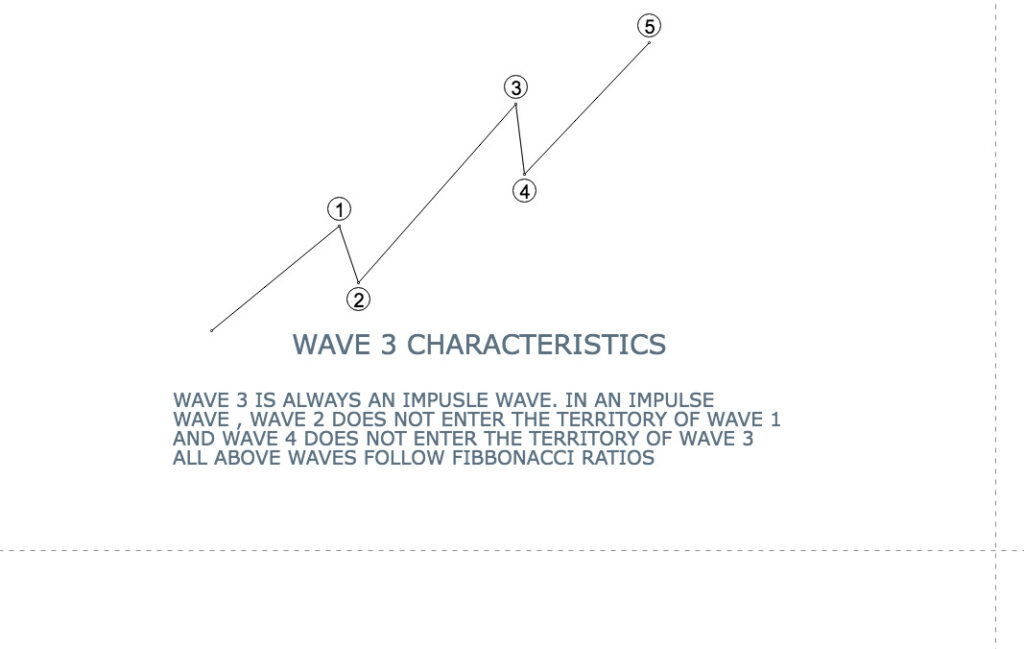
Above , a simple 5 wave move is depicted in which waves 1 , 3 and 5 are moving up and waves 2 and 4 are the downturns. All these waves are circled for easy understanding into the next graph . Now in elliot wave we have a theory of fractals meaning that each wave is subdivided exactly the same way as the parent wave. This you will see in the graph below
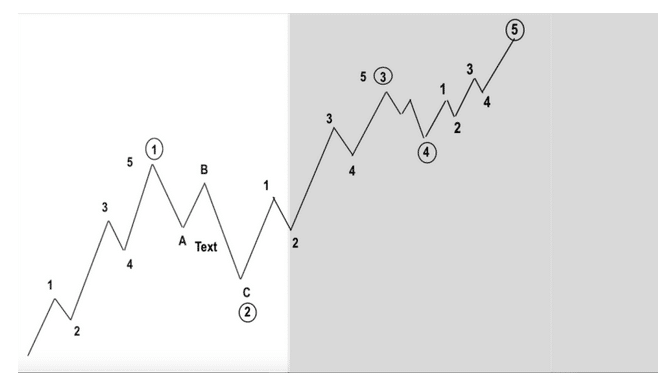
This process repeats itself in the shortest and the largest time frame.
Now the question of course arises -when do we assume that the major bear run has commenced .
To answer this we must have one logical condition other than the technical analysis- That the markets should have come a long way from the previous major bottom. Let us have a look at the chart below of the NIFTY
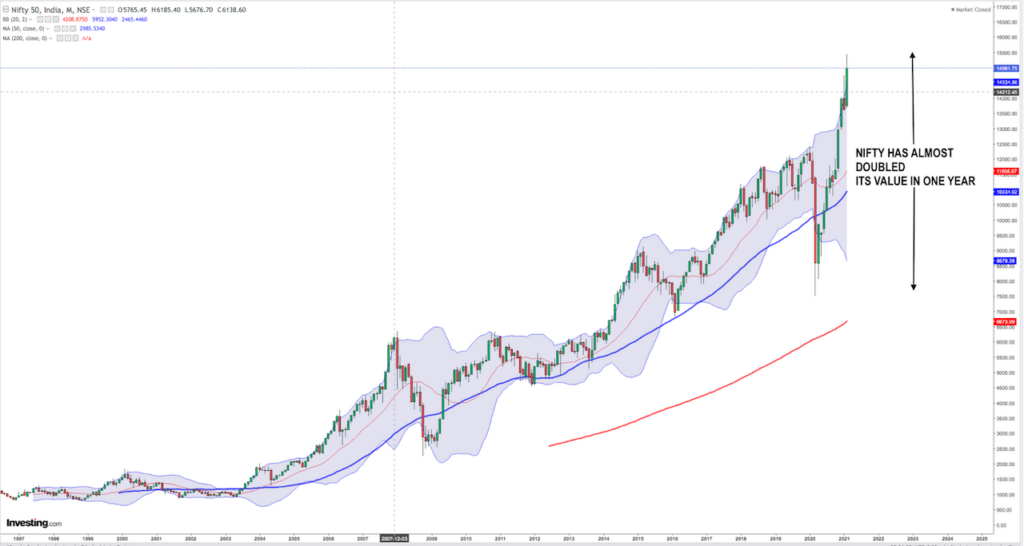
Above is a ‘monthly candle’ chart(each chart shows one month). For clarity let us see the rise of last one year in a hourly chart( zoom in)
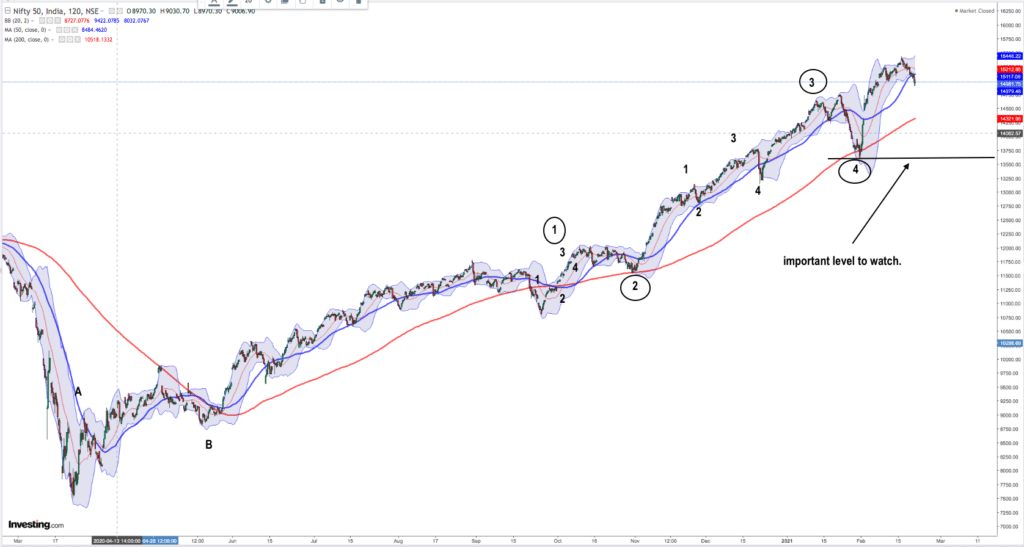
Looking at above charts, it becomes evident why we need to be careful. (Although we can/may still go up another 1000 points!!)
I will avoid answering the question of ‘ when is the final downturn confirmed’ for now and leave it to the graphs above to portray it.