In the last update , we had mentioned following
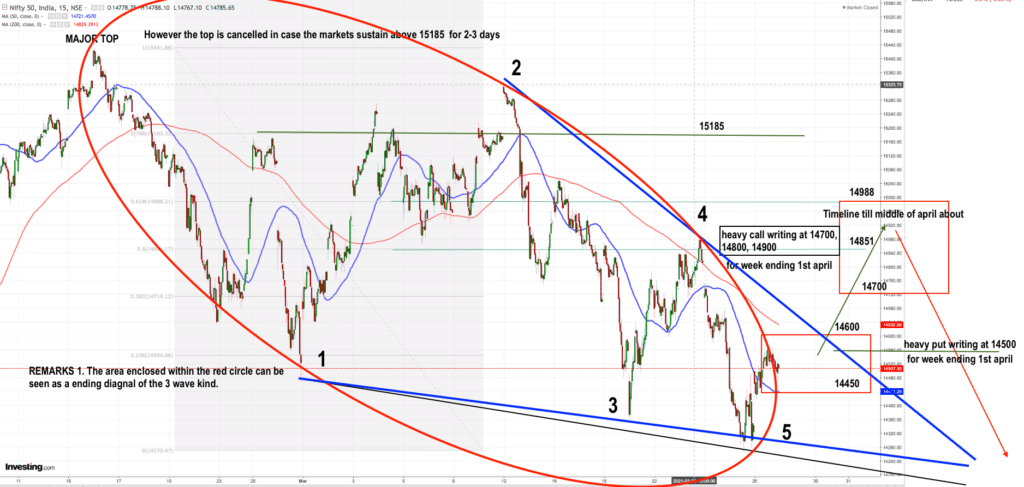
‘Right now in all probability the markets , as shown in the graph below will remain in the range of 14900-14500. (However 15000 level cannot be discounted too)Then a lower swing is expected which will take us down below the previous low of 14350.’
The markets touched the intraday low of 14277 and rebounded from there.
In coming to the above low of 14277, the markets traced a leading diagonal pattern right from the market high. The leading diagonal has five legs marked 1-5 in the chart below. All legs of this diagonal have 3 waves each , which means that the whole pattern of the leading diagonal is not a wave 1 but most probably wave A which practically means following
Any present or future upside is to be seen as a pullback correction of the down move started from the historical high of 15400 or so.. This pull back can take us to 14700 to even 15000 levels. This move up will be the wave B ending of which (14700-15000) will signify the start of the big C wave move downwards.
This wave C downwards when it comes will be of significant strength and will take us down to well below the previous low of 14277.
So it all boils down to this-
Expect a pullback from present levels to around 14700-15000 levels. The markets then should take a strong correction , going much below the previous low of 14277. Once we have the down move started , we will further analyse on the price action.
Above analysis is based on elliot wave projections and theory. This theory is highly subjective(different people get different results.) Please consult your own certified financial consultant for the fundamentals of the markets before deploying your money.
However Elliot wave theory works on a principal of high probability.