Stock Market Technical Analysis Course
About Course
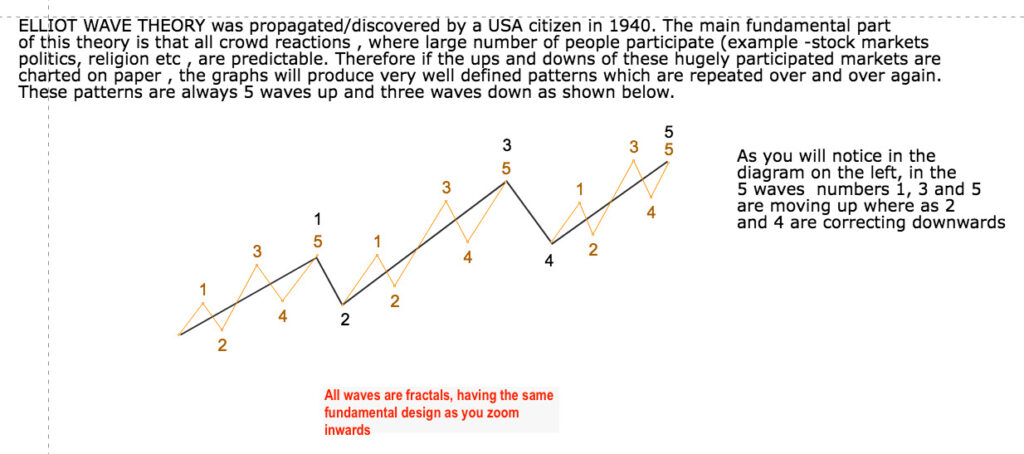
All technical indicators including ELLIOT wave analysis and FIBONACCI levels in detail.
Course Content
Technical Analysis of All Charts
-
Introduction to Stock Charts
-
Types of Charts: Bar Chart, Line Chart & Candle Stick Charts
-
Useful Resources for Stock Technical Analysis
-
Trendlines with Practicals
-
Channelling with Practicals
-
Candlestick Patterns with Practicals
-
Main Indicators : Introduction & Explanation
-
Elliot Wave Analysis With Practicals
-
Fibbonacci Ratios
-
Patterns in Technical Analysis