Elliott Wave Theory and traditional indicators are two different approaches used in technical analysis to analyze financial markets, including stocks, forex, and commodities. Both have their uses but have limitations when used practically. Understanding this can help an investor/trader tremendously, as both do not give hundred percent results. Below I will give a brief description of both and my personal take on how to approach the two from my past experience.
ELLIOT WAVE THEORY
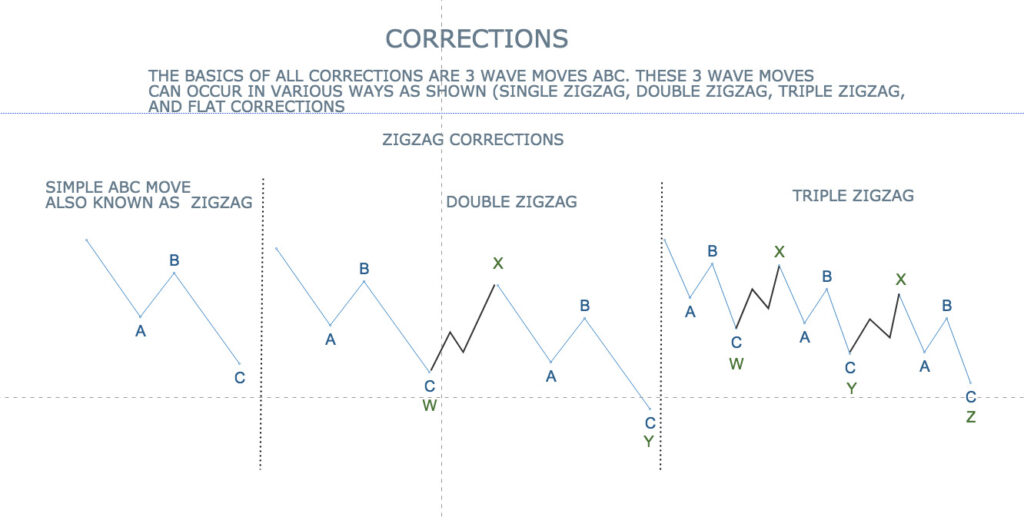
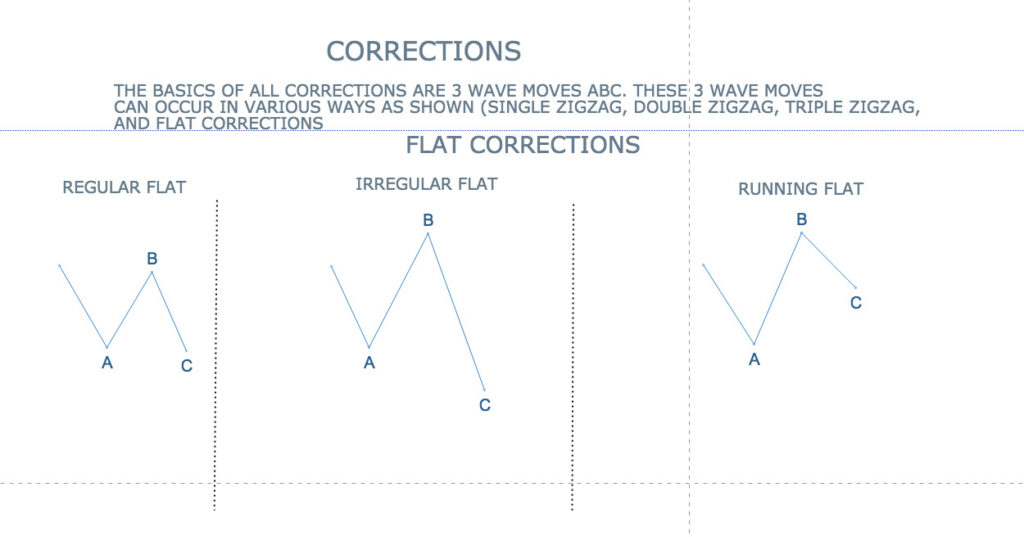
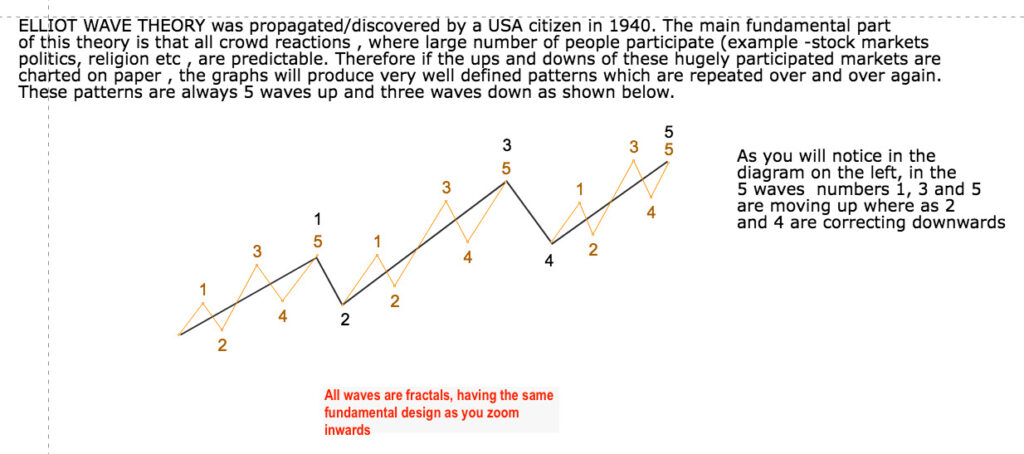
Elliott Wave Theory was developed by Ralph Nelson Elliott in the 1930s and suggests that financial markets move in repetitive patterns or waves, which are driven by investor psychology. These patterns are similar and can be STANDARDISED.
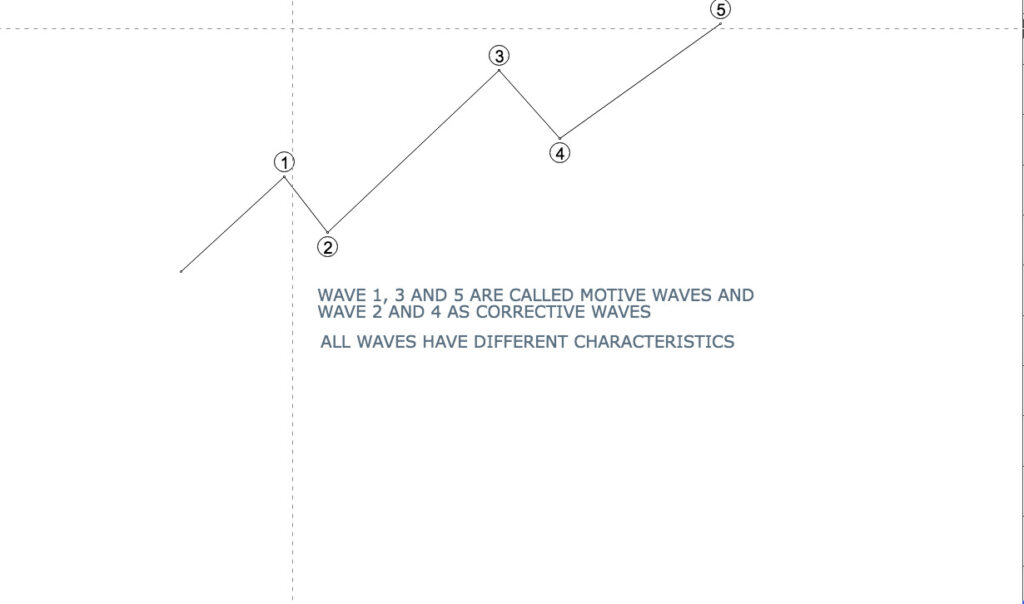
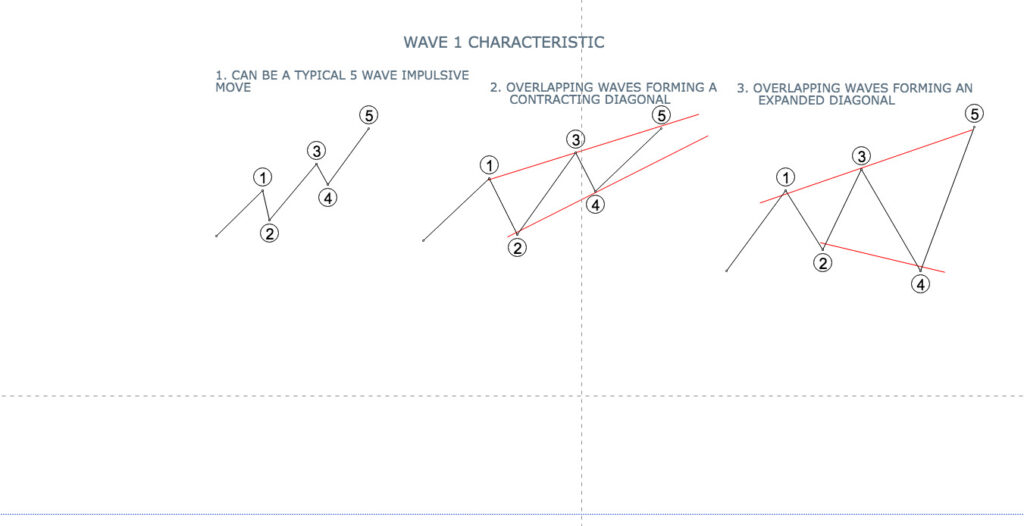
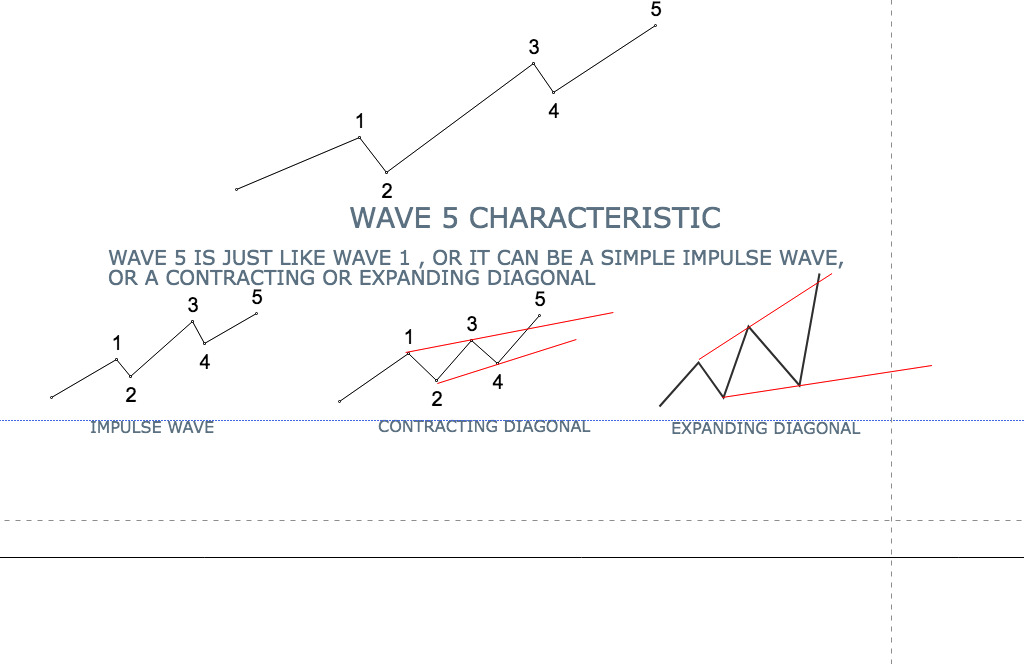
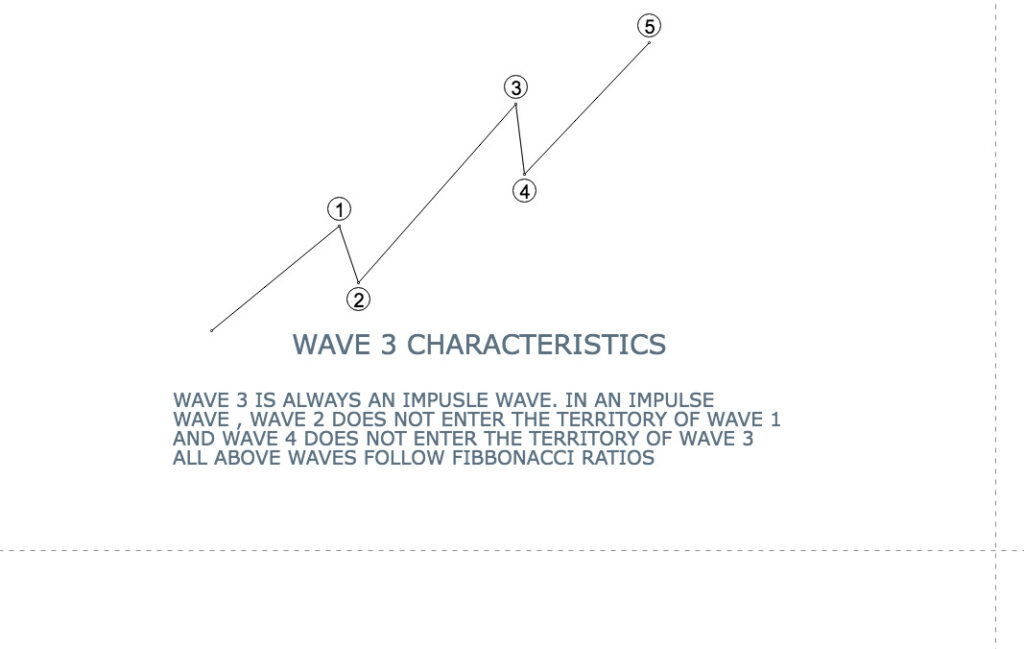
According to this Theory, markets go through waves of upward and downward movements in a predictable pattern of five waves in the direction of the trend (called impulse waves (1-2-3-4-5) followed by three waves in the opposite direction (called corrective waves A-B-C).
Identification of these waves becomes highly subjective as one goes into different time frames and finally boils down to individual prowess and experience. However with practice, one DOES start getting a feel of these repetitive patterns, and missing out on any major moves reduces considerably
TRADITIONAL INDICATORS
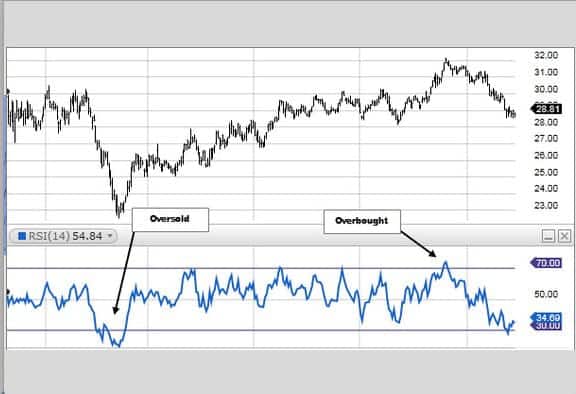
Traditional indicators in technical analysis(eg RSI, MACD, Volatility Index, etc) are mathematical calculations applied to price and volume data to identify trends, patterns, and potential trading opportunities. Almost all work on an oversold and overbought basis and rely heavily on the premise that markets have a limitation in a particular rise and fall in a given time.
The biggest advantage these indicators give is a MECHANICAL SYSTEM akin to green and red traffic lights.
However, these signals are NOT ALWAYS RIGHT as at times we DO have FREE FALLS (At times event-triggered) and STUPENDOUS RISES. Markets can be overbought and oversold for a long period of time, thereby putting the investor and the trader on a continuous WRONG DIRECTIONAL PATH.
Traditional indicators include popular tools such as moving averages, trendlines, support and resistance levels, relative strength index (RSI), moving average convergence divergence (MACD), Volatility Index, and many others.
APPROACH
The most logical approach would be to develop a trading system based on both, where the two systems complement each other. This requires a deep knowledge of both and streamlining the same in such a way that one is NEVER caught up in the stop-loss syndrome. (More about this later) An ideal trading system in my opinion would be where
-Losses on paper are ALWAYS limited.
-There is practically NOTHING like stop loss in the trading system
-One is always experiencing familiar situations
When all the above three are taken care of, sentiments, emotions, and SIXTH SENSE will stop playing a role in one’s trading decisions.