NASDAQ
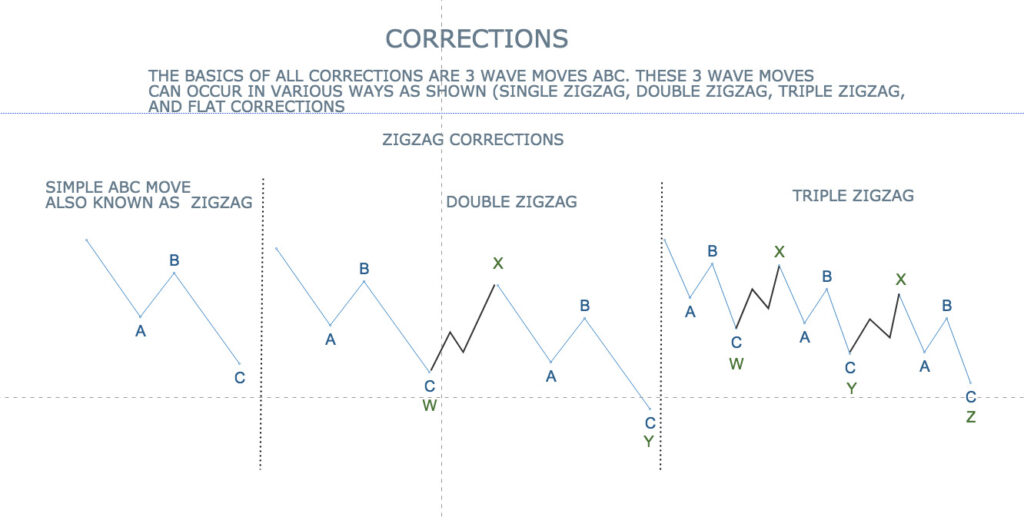
Market tops are always difficult to pin point and can at times take for ever. However one needs to take due notice every time a possible wave count points towards the same. Analysis should be taken more as a risk assessment rather than exact timing of the markets up and down gyrations.
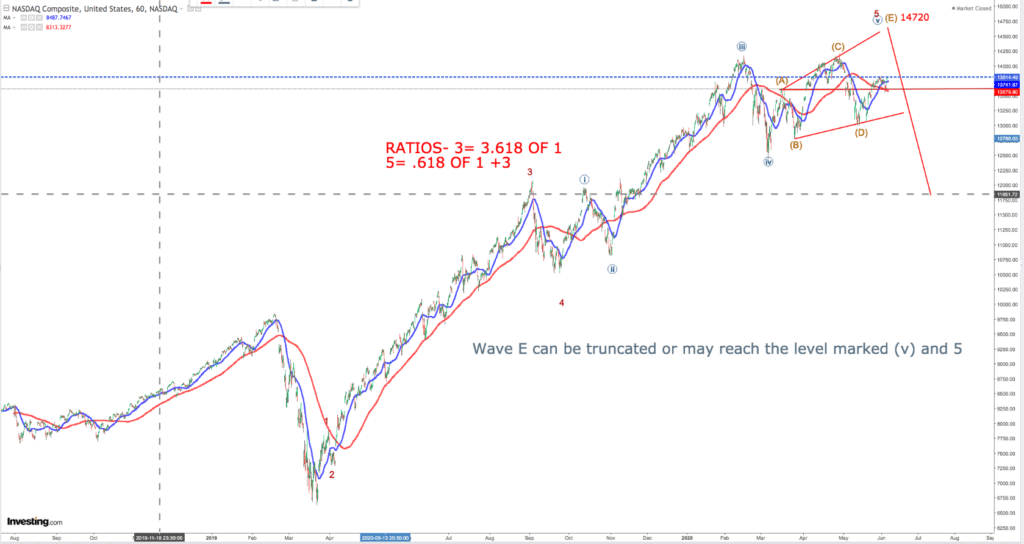
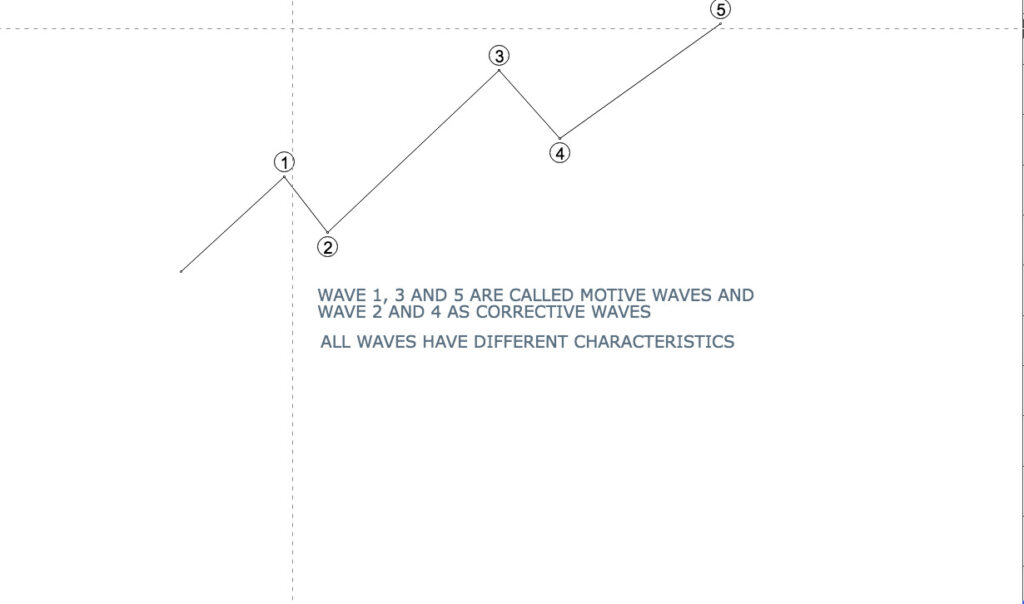
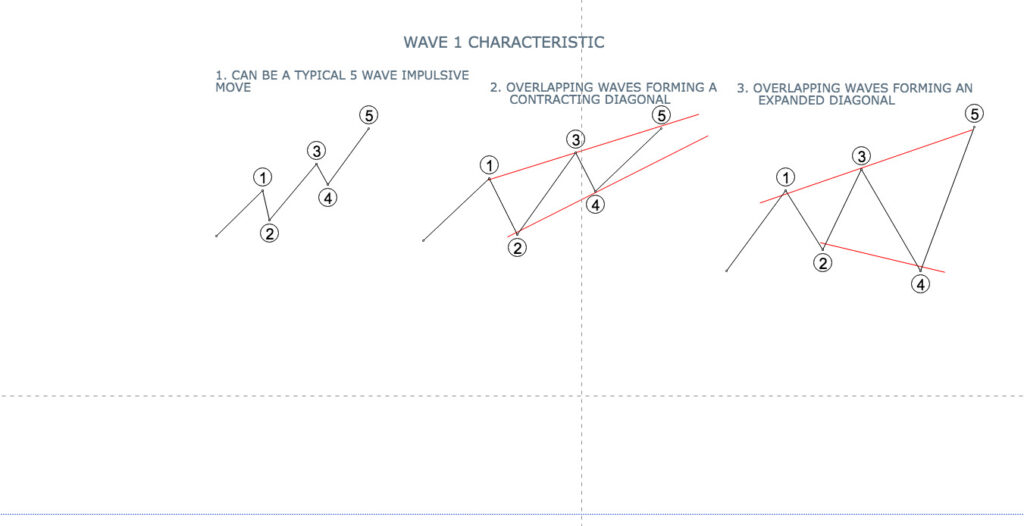
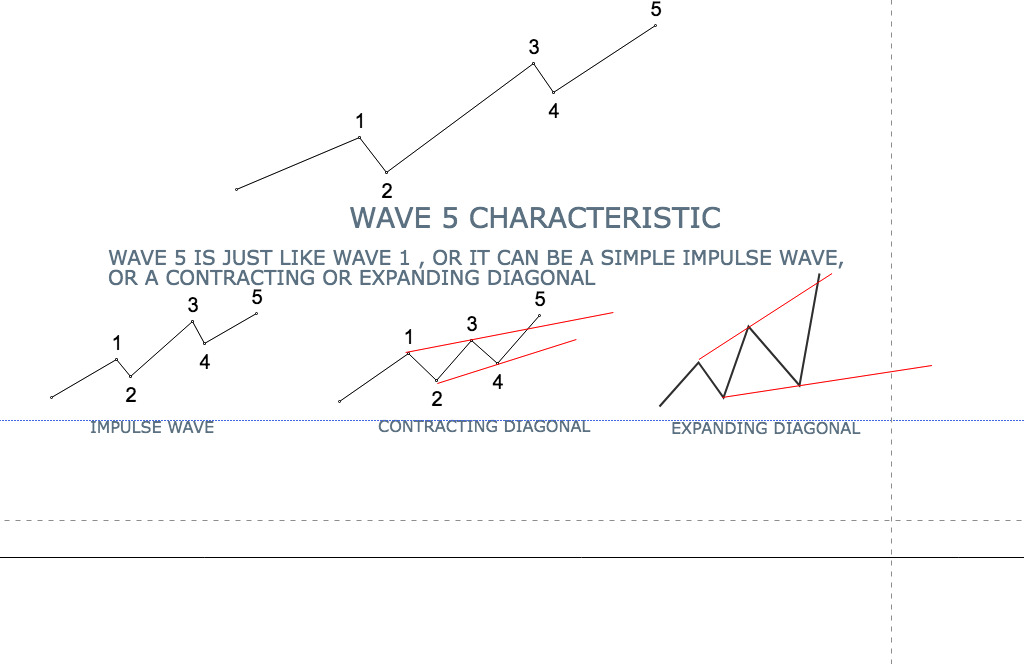
The 5th and final wave in Nasdaq may be finishing in a 5 wave diagonal movement, where all 5 waves are overlapping and final level of the projected ending for the 5th wave is exactly as per elliot rules or .62 percent of the height of wave 1 and wave 3 combined.
Can the markets on reaching the above level strike out on a 5th wave bull run. POSSIBLE but 1st it will need to correct a percentage of the whole diagonal height. (Wave 1 and wave 2 of the new bull run)
This presently looks unlikely .
DOW JONES
Dowjones too is showing signs of topping out. Below I am giving two charts with possible targets. Both are very much possible.
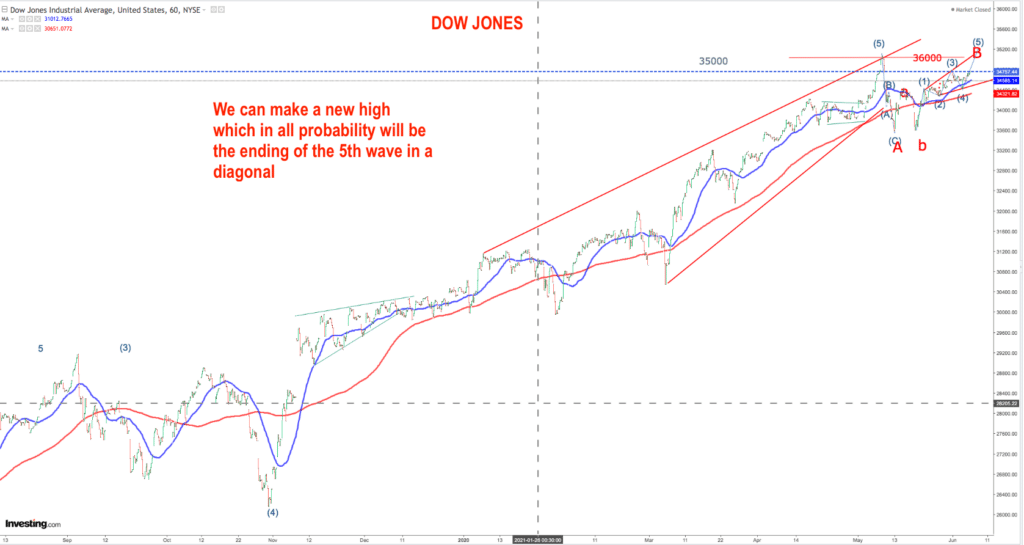
In this the diagonal is that of a wave c , which can take the markets higher than the previous high BUT within the bearish ambit.(Or big possible correction from there.
There is a second alternative where dow jones will go much higher , assuming a LATE completion of wave 5 as shown below
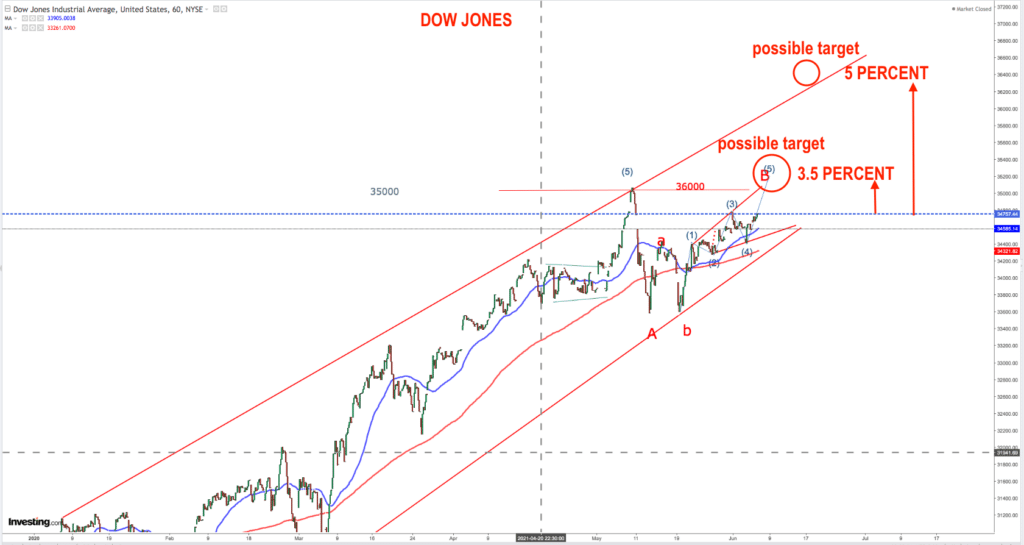
So this 2nd alternative target is still 5 percent away.
The wave analysis is there to bring into focus the risks involved and to help in risk assessment.
Disclaimer Elliot wave analysis is highly subjective in nature and is a study of various possibilities in a huge range. Please use your own judgement and fundamental approach in your investments.