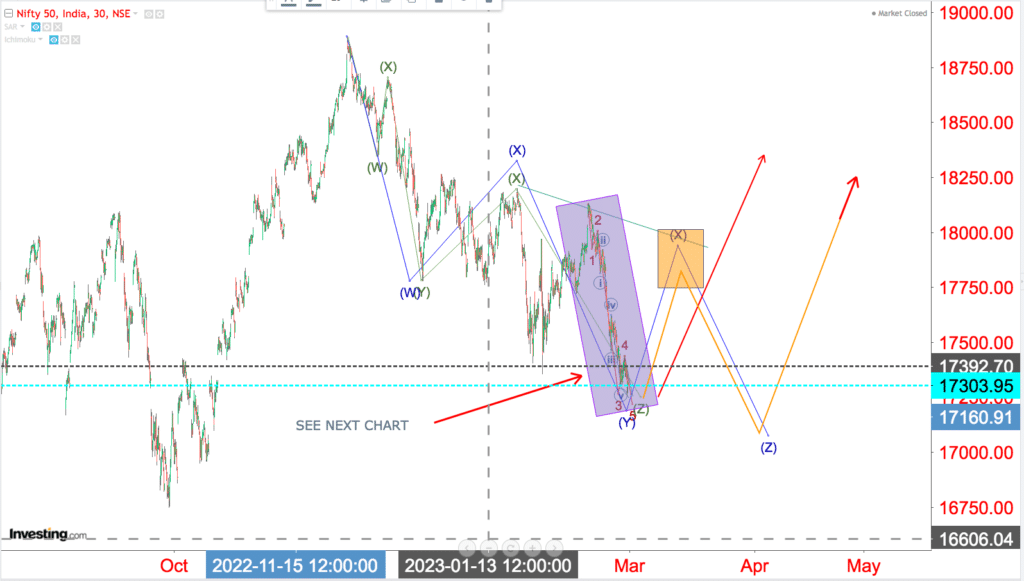
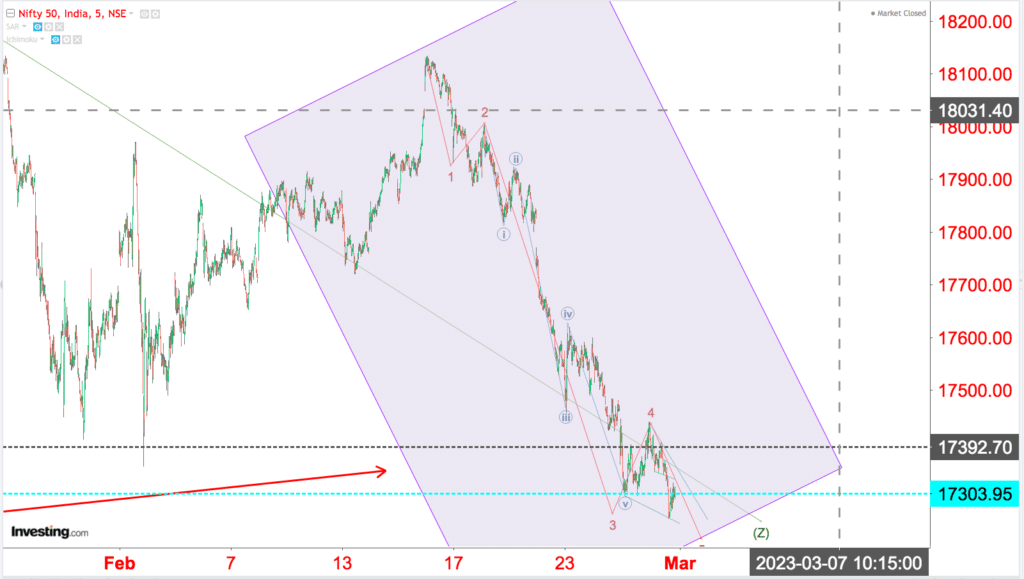
The basic count remains the same as my cancelled one, that is we are in the process of completing a zigzag correction. However since the c wave down has extended a bit, I have given two alternatives for the correction to complete.
In the 1st chart , the green count is near completion and from around here we should start forming a base for correction to complete. In the blue count the C wave of WAVE Y is near completion and from around here we should start moving up for the final wave X
In both cases we should be moving up by tomorrow afternoon in any case if not earlier.