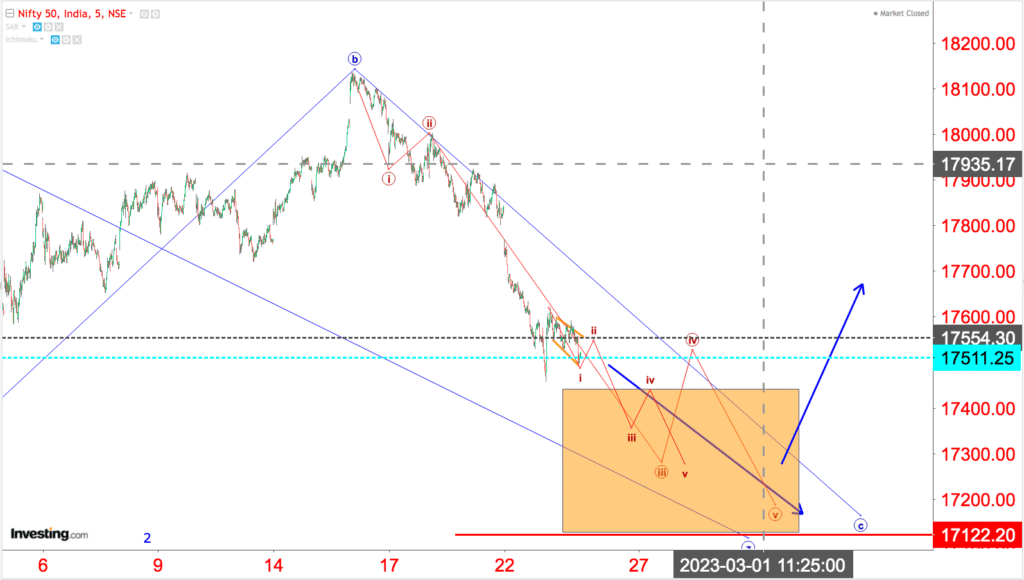
In my previous analysis I had given two options for lowest levels. In the blue count a zigzag move down till 17122 and in the red count an impulsive wave down with much lower levels as shown in 1st figure.
Now I am considering only the blue count and in the second figure i have numbered the waves as part of wave c going down
In short- we may have a short pullback today which may or may not last for one full day and then markets to move down to complete the wave z as shown in second image.