There is a good probability that the markets MAY have reached a bottom OR are very near the bottom.
This is deduced from the fact that there are multiple signs as follows
We may have made an ending expanded triangle
OR
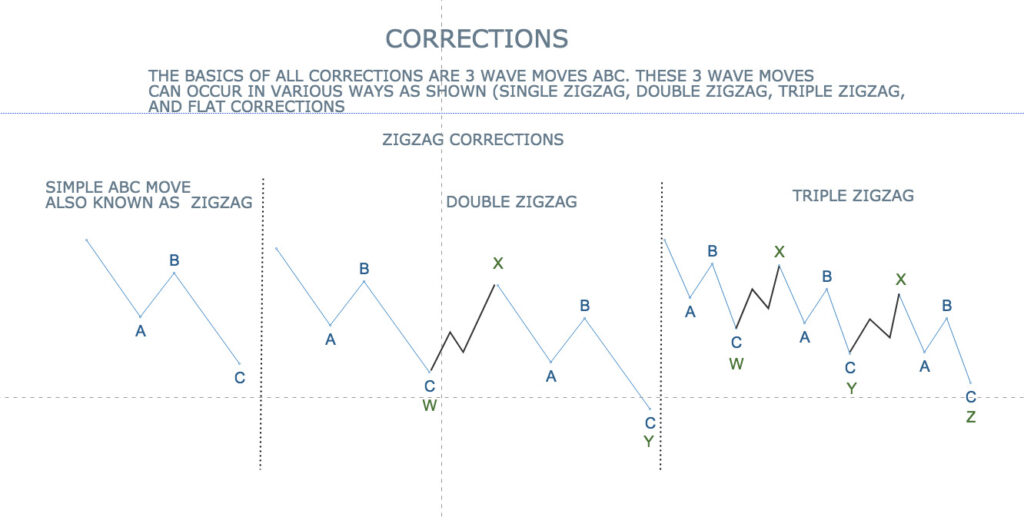
A triple zigzag correction completing at the bottom made
In any case, we need to observe the next 2-3 days’ price action to be sure of above analysis
In case it is an ending expanded triangle we may test the lower end of the triangle again
In Elliott wave analysis, an expanded triangle is a specific type of corrective wave pattern that occurs within a larger trend. It is a complex pattern that consists of five waves labelled A-B-C-D-E.
In an expanded triangle, wave A is a three-wave pattern that moves against the overall trend. Wave B is a three-wave pattern that moves in the direction of the overall trend, but it does not exceed the start of wave A. Wave C is a five-wave pattern that moves against the overall trend and is typically the longest and most complex wave in the pattern.
Wave D is a three-wave pattern that moves in the direction of the overall trend, but it does not exceed the end of wave B. Finally, wave E is a five-wave pattern that moves in the direction of the overall trend and typically ends beyond the end of wave C.
One of the key characteristics of an expanded triangle is that each of its waves usually shows more significant price swings than the previous wave. This creates a triangle pattern with a wider price range as the pattern progresses.
Expanded triangles can occur in both bullish and bearish trends and are often found in higher time frames. They are important patterns to recognize as they can signal potential trend reversals or opportunities to enter a trade with a higher probability of success.
In summary, an expanded triangle is a complex corrective wave pattern that consists of five waves labelled A-B-C-D-E. It is characterized by each wave showing more significant price swings than the previous wave, creating a triangle pattern with a wider price range. Expanded triangles are important patterns to recognize for traders and investors who use Elliott wave analysis to identify potential market trends and reversals.