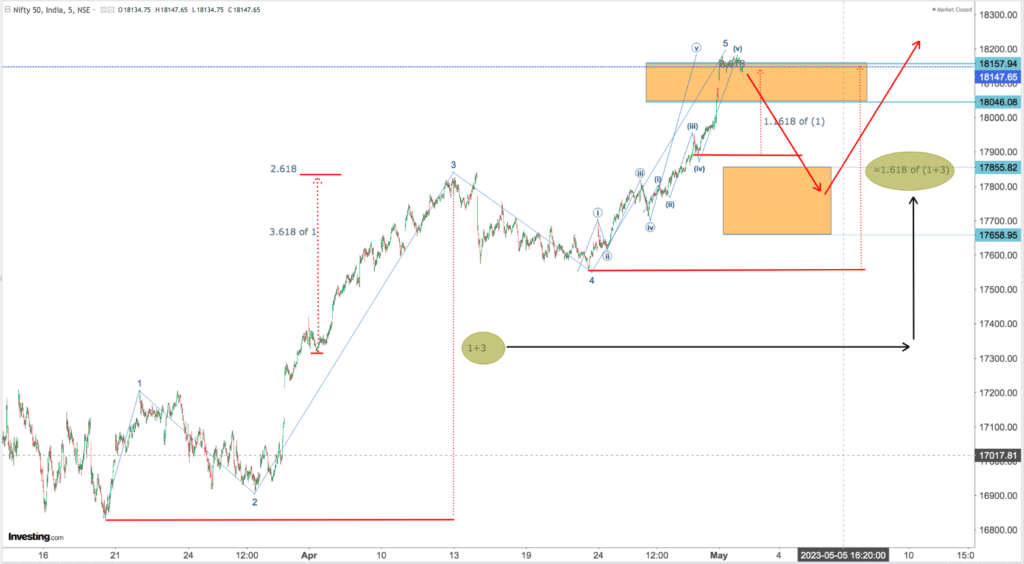
Markets have taken a pause at current levels and SEEM has completed 5 waves of smaller degrees. I have drawn the Fibonacci ratios at all relevant points on the chart for the current impulsive wave. The markets have behaved in almost a controlled manner with all wave counts and ratios as per the wave theory.
From current levels expect the markets to fall as shown above. IN ALL LIKELIHOOD this fall will be in line with wave 2 of a larger degree with markets subsequently climbing to greater heights ONCE the present fall peters out at around 17500-17700
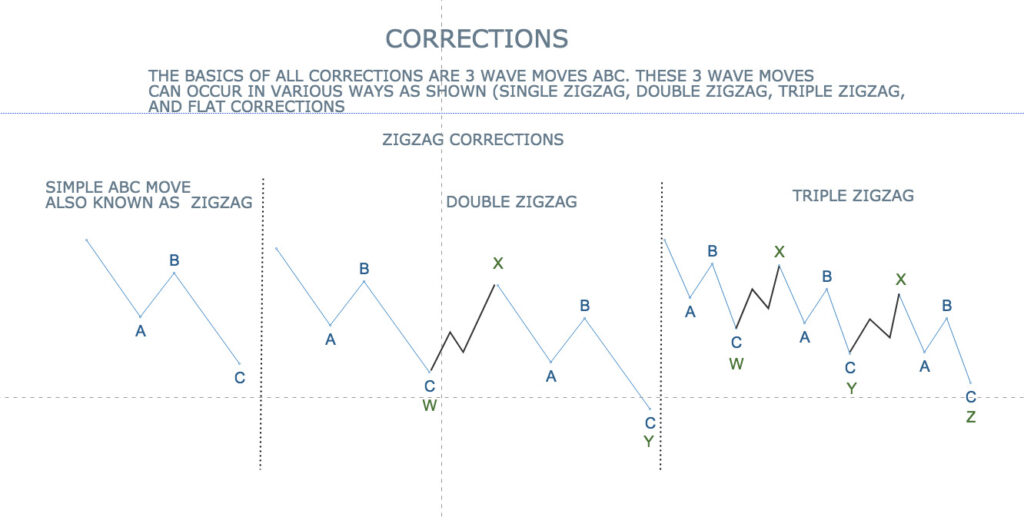
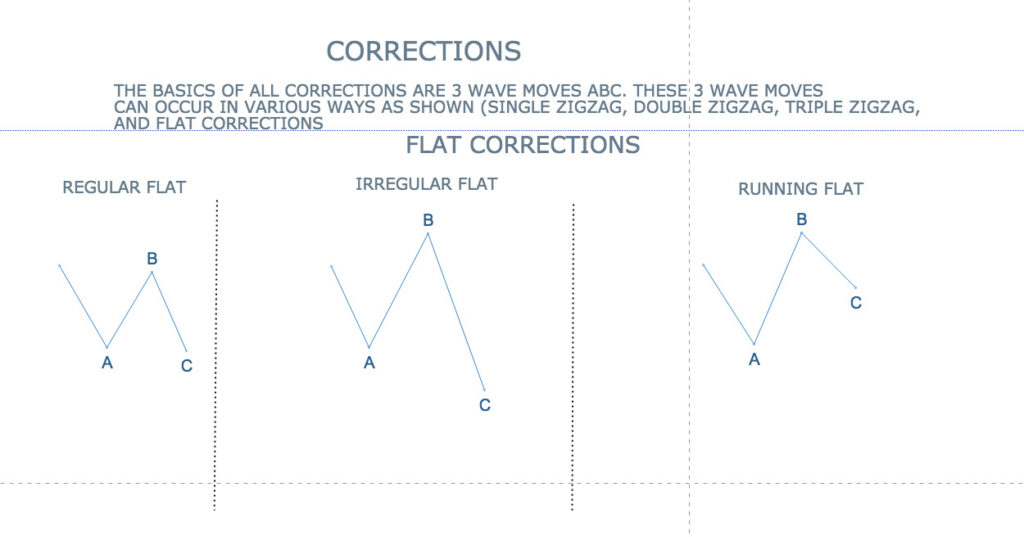
FIBONACCI RATIOS AND THE WAVE THEORY
It is fascinating how the Fibonacci ratios are truly interwoven with the Wave theory when applied to the stock market. Where the Fibonacci ratios are linked to nature in a mathematical manner, the stock market is “SAID TO BE BASED ON FUNDAMENTALS AND POLITICAL UPHEAVALS”.
The first ten numbers in the Fibonacci sequence are 0, 1, 1, 2, 3, 5, 8, 13, 21, and 34. These numbers have been found to occur in various patterns and ratios in nature, such as the arrangement of leaves on a stem, the branching of trees, the spiral patterns of seashells, and the proportions of the human body. However far-fetched this may sound, it is true to a LARGE extent. The most commonly used Fibonacci ratios in trading are 0.382, 0.500, 0.618, 0.786, and 1.618.
RISKS INVOLVED IN BEING TOTALLY DEPENDENT ON THE WAVE THEORY
The wave theory , propagated 1st in 1930 is a work in progress. With the advent of computer softwares and AI and subsequently algo trading, the wave theory now is within reach of a larger number of traders than before. However one has to keep in mind that the very basis of the wave theory is about taking into consideration a large number of possibilities and THEN arriving at the most likely outcome.