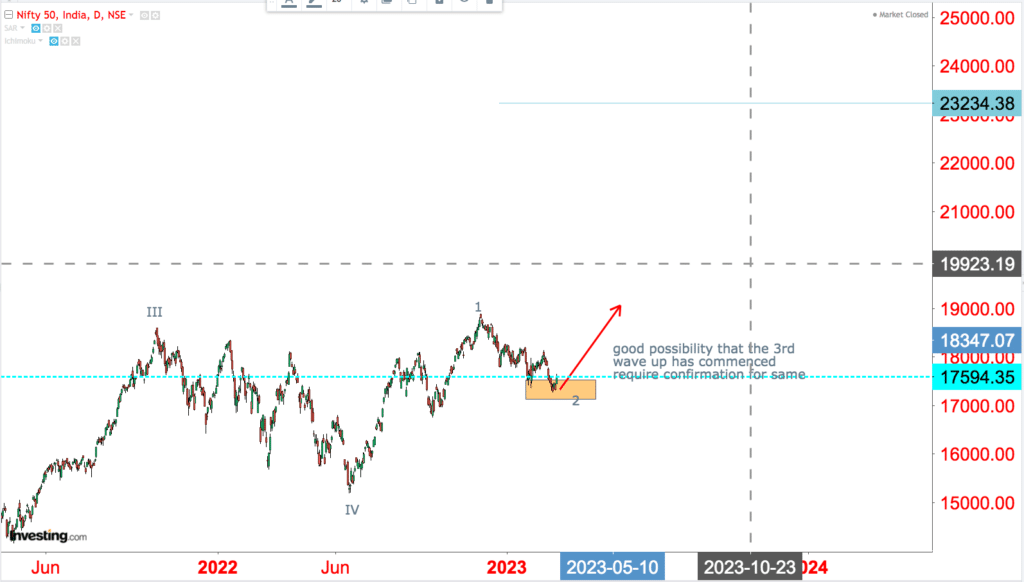
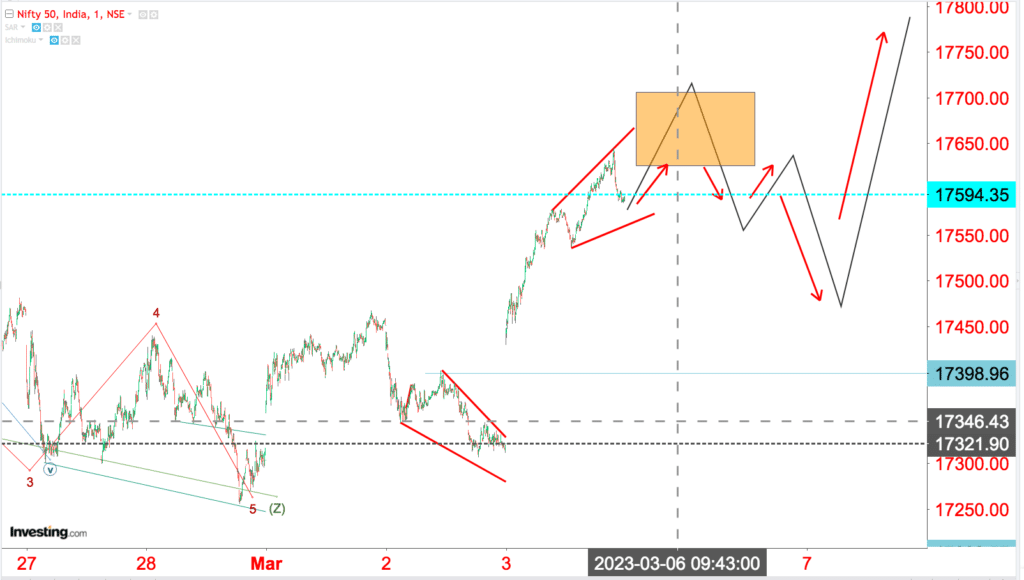
In the 1st figure above, I have shown the POSSIBLE route of the BEGINING of wave 1 of the final bullish cycle wave V. In the 2nd figure I have shown the culmination of correction as wave “Z”
Considering above count it is very unlikely that the bottom made at point marked”Z ” will be broken for some time forward.
The question arises as to how wave 1 in a larger time frame will play out. will it be a overlapping “3” structure OR a 1-2, 1-2 structure this time can only tell. In every dip there is potential for upside AS LONG AS “point marked “z” is not broken on the downside.