NIFTY Opening On 4th May 2023 1
NIFTY Opening On 4th May 2023
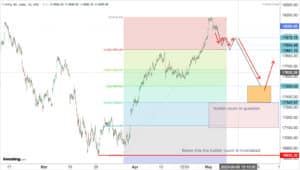
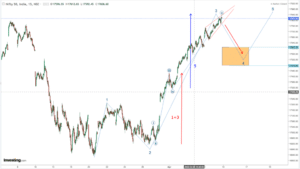
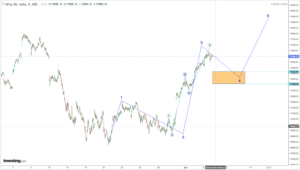
I have given two charts above. The 1st one is the current RECENT price action and the second is a bird's eye view of the impulse wave which commenced from…
I have given two charts above. The 1st one is the current RECENT price action and the second is a bird's eye view of the impulse wave which commenced from…
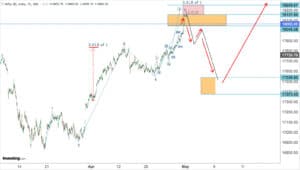
In my previous analysis , I had mentioned the possibility of wave 3 and wave 5 extending, (both on smaller and larger degree). I had also stated the possibility of…
In my last Nifty analysis, I mentioned that wave 5 on a smaller scale is showing signs of extending. I had also shown the extent to which it can rise.…
Nifty took a correction but rose again with a smaller impulse showing not ready to give up. Markets are overbought both on hourly and daily time frames. Considering "minor" waves…
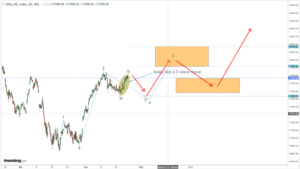
Nifty - I have marked as wave "x" the last upswing, as giving an indication of a double (triple zigzag?) In case it is we should correct as above and…
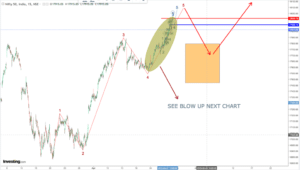
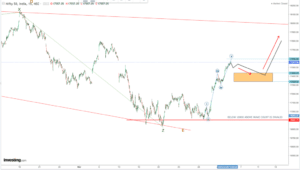
In my previous Nifty analysis, I mentioned the possibility of markets having made a bottom or very close to the bottom. Markets rose as expected and now we are somewhere…
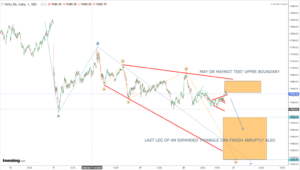
Nifty - Markets are in the process of completing an expanded triangle, where the last leg of wave "e" is on. The culmination of this triangle will mark the completion…
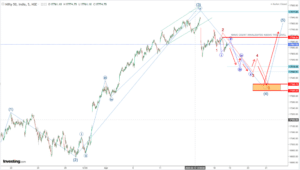
We may be having a 1-2 1-2 formation where the SECOND wave 2 is just completing or near completion. Then we should have the downward move resume again. REGARDING OVERLAPPING…
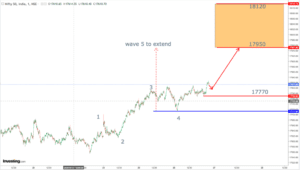
Wave 3 Nifty has extended as shown. Extensions CAN occur in wave 3's. A lot of overlapping at present levels, with markets being egged on by short covering. Correction should…
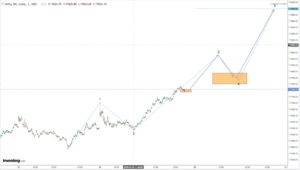
Wave 3 is now overdue for completion and we should be correcting it anytime soon as shown. However, Wave 5 when it comes should extend, taking us near/beyond 18000 as…
We may have completed the 1st in the series of forthcoming IMPULSE waves and now should correct as shown above before resumption of the bull run. Below is a small…
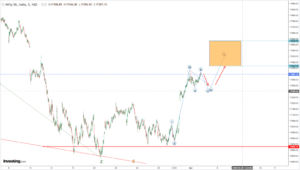
We have completed one pattern on the downward side at the point marked "Z" in the chart above. Subsequently, we pushed upward and now are nearly 600 points above the…