Skip to content
Mass Wave India
  • Home
  • About Us
  • Contact Us
  • Free Analysis
    • Gold
    • NASDAQ
    • NIFTY
    • USD / INR
  • Book Courses
  • User
    • Student Registration
    • Dashboard
    • Lost password
  • 0
0
  • Home
  • About Us
  • Contact Us
  • Free Analysis
    • Gold
    • NASDAQ
    • NIFTY
    • USD / INR
  • Book Courses
  • User
    • Student Registration
    • Dashboard
    • Lost password

Blog

The magic of 50 day and 200 day moving average.

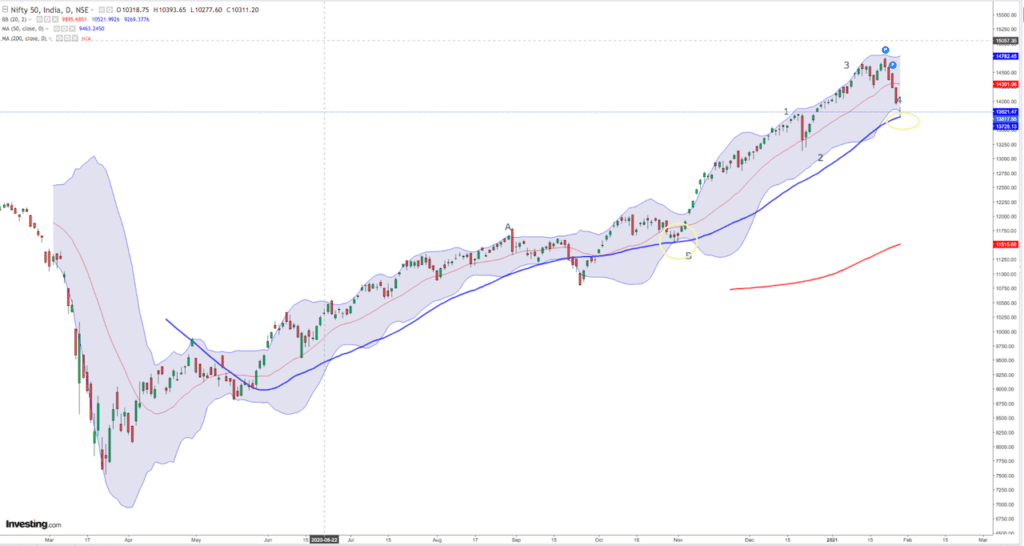
Above is a simple 50 day moving average. One can see how the markets react on touching this and then moving higher. Along with a 1 minute elliot wave analysis one can have a confirmation of same

  • Post published:28/01/2021
  • Post category:Others

You Might Also Like

21.02.2021 When to square up your positions in the markets

21/02/2021

NIFTY IN ALL TIME FRAMES OPENING ON 6TH SEPT 2021

05/09/2021

15th feb 2021 Nifty hourly chart

15/02/2021
  • Terms & Conditions
  • Privacy policy
  • Cancellation / Refund Policy
  • Disclaimer
Copyright @ MassWaveIndia | Designed by Utopian Gateway
×
×

Cart

Insert/edit link

Enter the destination URL

Or link to existing content

    No search term specified. Showing recent items. Search or use up and down arrow keys to select an item.