Nifty Stocks & Nasdaq NIFTY ACC ADANI ENT ADANI PORTS APOLLO HOSPITAL APPLE ASIAN PAINTS AXIS BANK BAJAJ AUTO BAJAJ FINANCE BAJAJ FINSERV BHARAT DYNAMICS BHARAT EECTRONICS BPCL CIPLA COAL INDIA...
NIFTY & Nasdaq Opening on 19th August 2024...
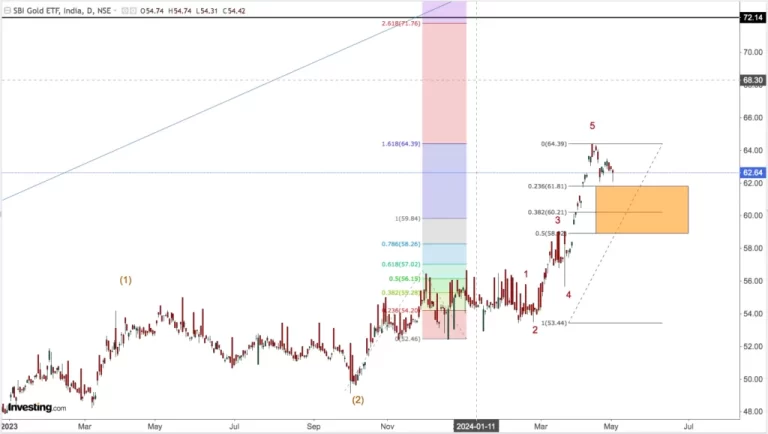
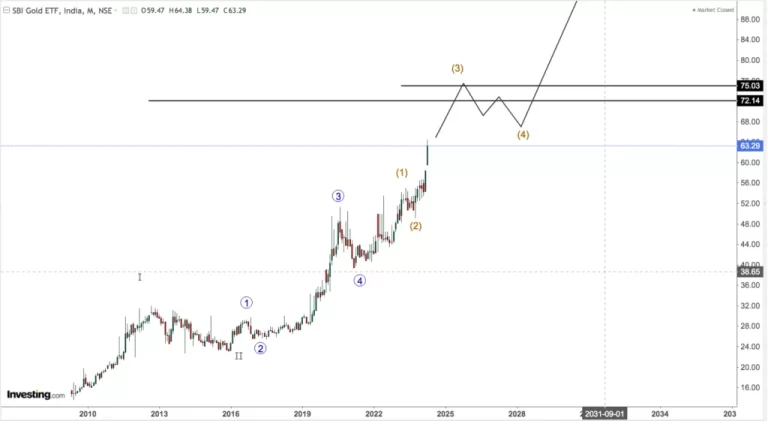

Elliott Wave theory is known to have a subjective aspect to it, which can make it challenging, especially for novice traders. Having a mentor is a must , who through his experience can guide and give...

Technical Analysis can be broadly divided into two categories, “Trend and momentum following indicators”“Predicting with repeated patterns (Elliot Wave )”The 1st one has a huge...
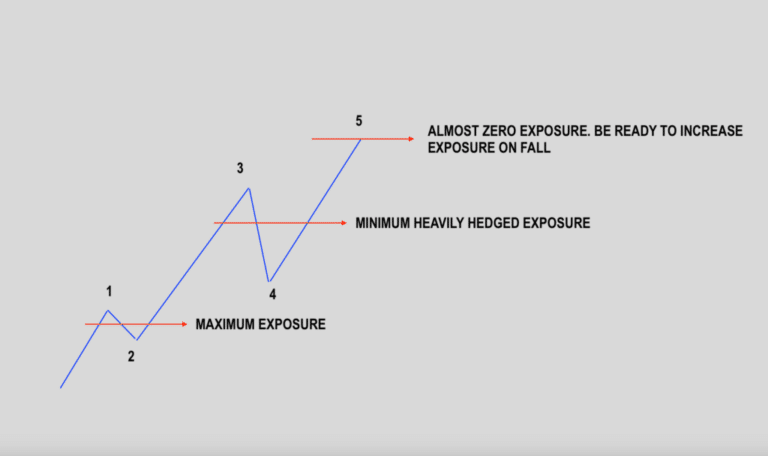
Trading in Stock markets, especially with derivatives has inherent risks. These risks can be mitigated by careful planning with the “Size Of Trade” and where one perceives the market to be...