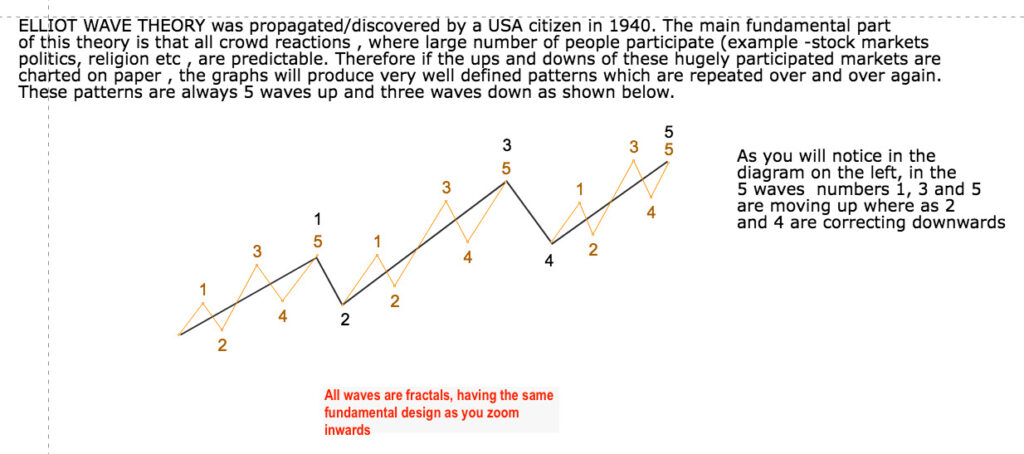
Elliot came out with his thesis in 1930 regarding how masses follow a herd mentality. This came to be known as the elliot wave analysis. Over the years it has gone through many subjective interpretations.
However the basic premise remains the same-
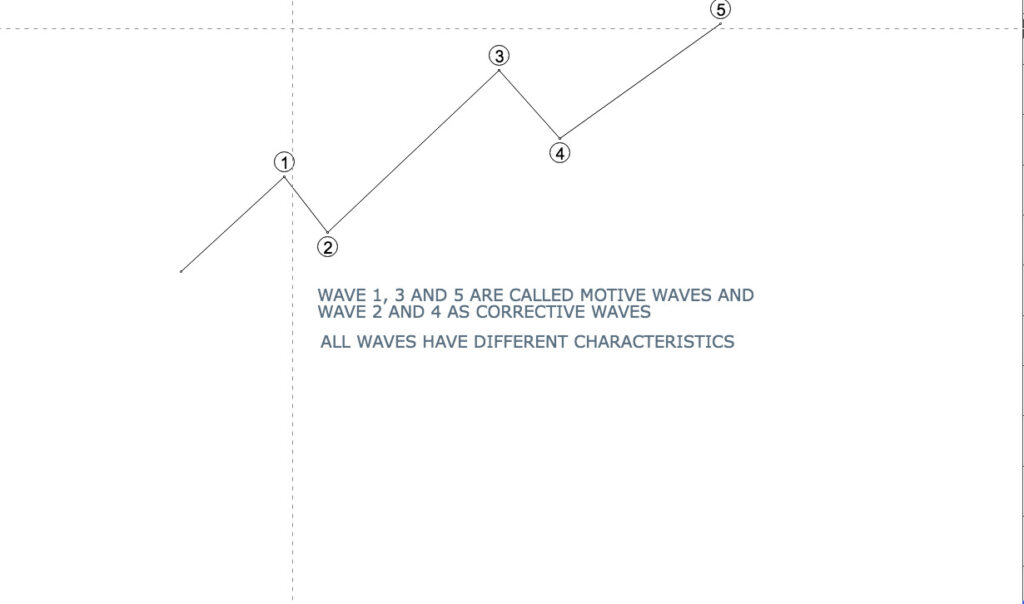
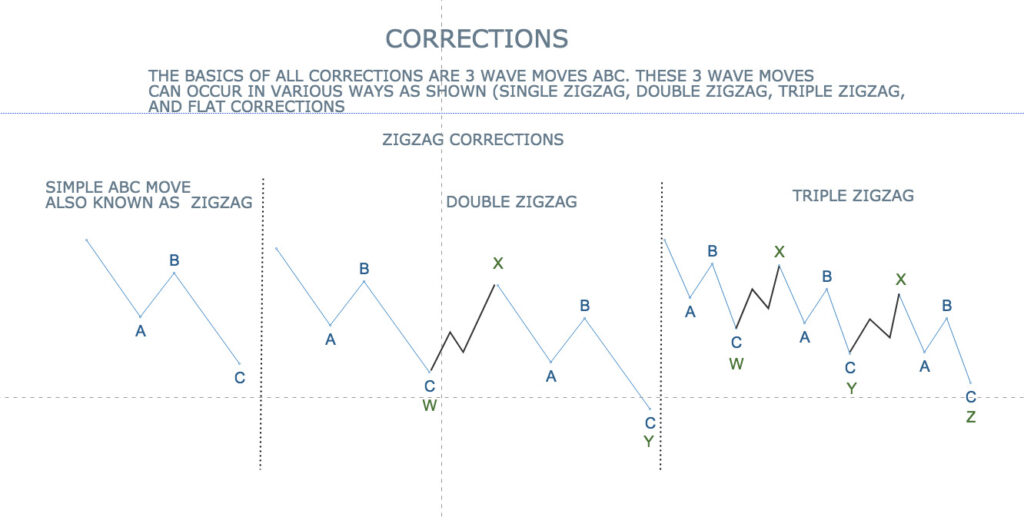
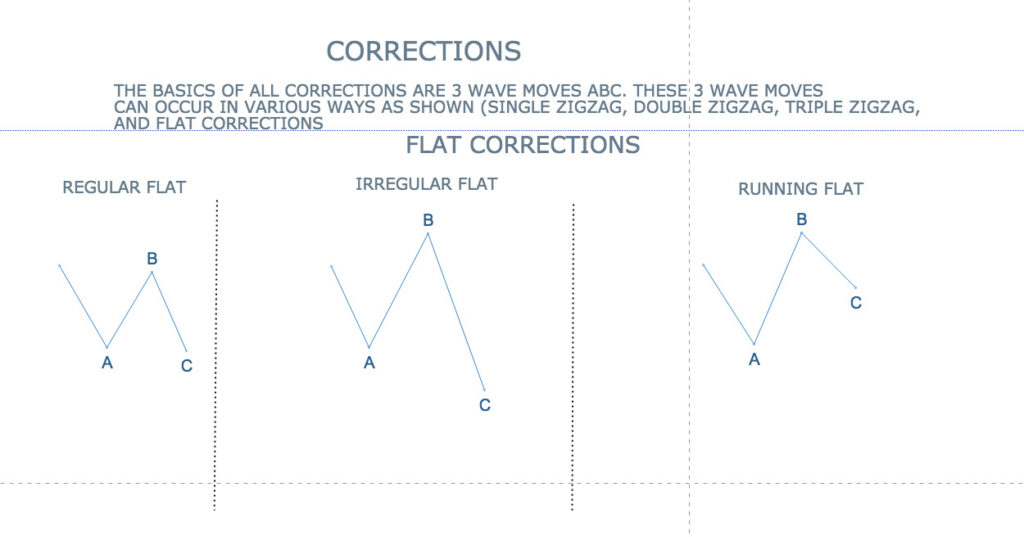
The markets (where a large number of participants are there) follow set patterns. These patterns occur in different time frames and are repeated over and over again(OR there is nothing new in the markets.)
It is true that any analysis based on the above and the rules and tenets of the wave principal, is subjective and any analyst can MISS a certain pattern at certain times thereby making the whole analysis(MAP) null and void for that period.
However it has been my experience that the wave analysis does come correct 70-80 percent of the times .
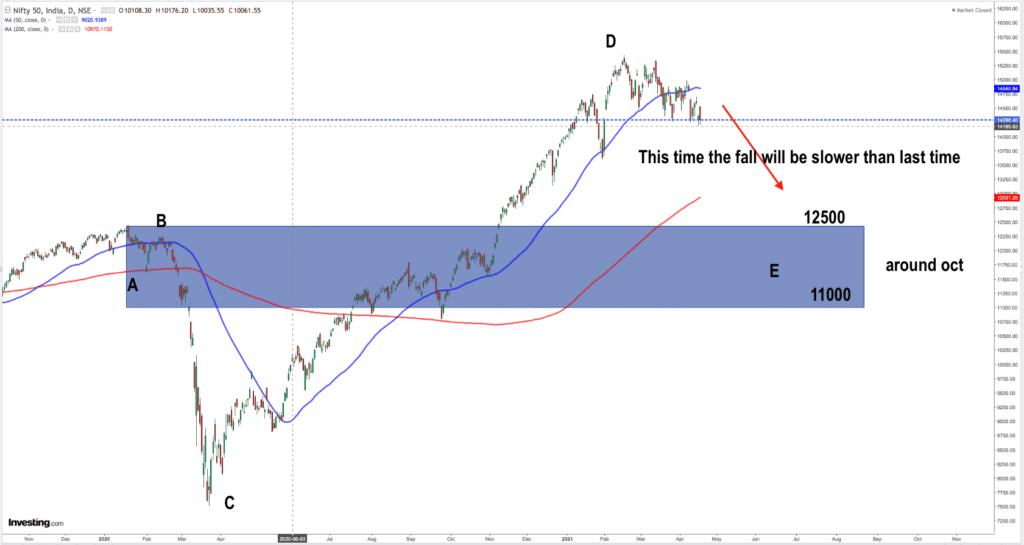
Let us consider the NIFTY long term below.
As you will see in the chart below, i have marked 5 major waves ABCDE, the wave E ending in the blue rectangular area marked . Also in the next chart i have marked the making of a huge triangular structure (A leading diagonal?) If correct then the upward pullback as the corrective has already occured the top of which is marked as point ‘c’ by a yellow ellipse.
It is to be noted that the the wave E (IF the wave analysis is correct so far) will be much slower as wave E is always varying from wave C in speed and shape.
As it will be slower the , timing calculation gives the low occuring in around oct or so.
Remember elliot wave is highly subjective(although have seen positive results at times of 70-80 percent) . Therefore DO consult the fundamentals before deploying any money.
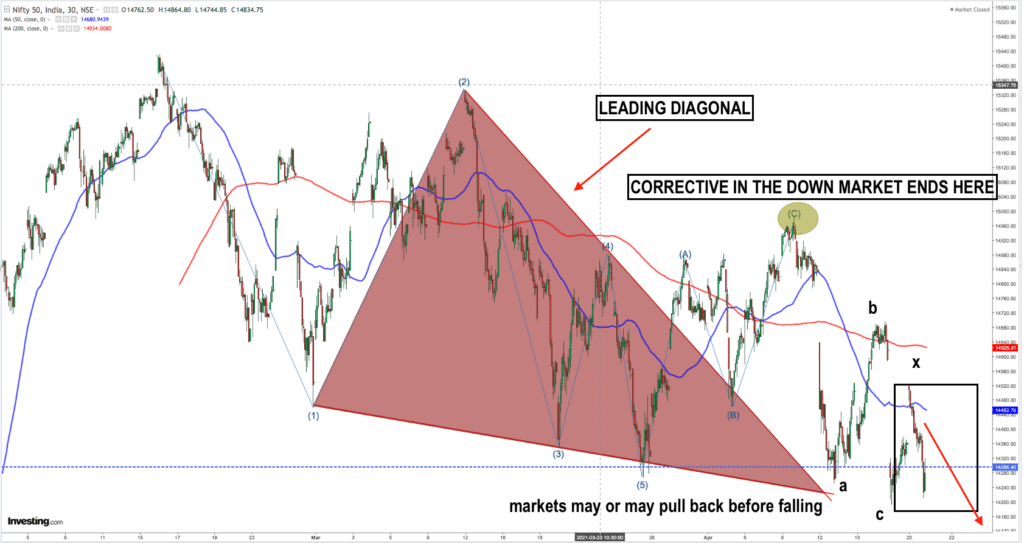
The leading diagonals (as shown by the red triangle above) always occur at the start of a big move. Once the leading diagonal completes, it has a pullback correcting this down move(Shown by the area marked in yellow ellipse.
From there the markets fall as per set rules , tenets patterns of the wave principal. (The herds behave the same way over and over again.)
Above has been shown countless times to our students in SHORTER TIME FRAMES
To surmise the long term analysis above
The markets are in a downward move. This downward move can take the NIFTY down to 12500-11000 range. This can take a protracted period of around six months.
Standard disclaimer Above analysis and all analysis in this forum is based on elliot wave analysis which is highly subjective in nature. Use this analysis as only a educational tool. Consult your own certified financial expert for the fundamentals before deploying you cash