Below analysis is given based on the elliot wave theory. This analysis is given free of cost . The wave theory is subjective in nature and based on predicting crowd sentiments and at time may vary from fundamentals of the markets. Therefore prior investing please consult your certified financial consultant.
The markets have by and large behaved as per the wave analysis.
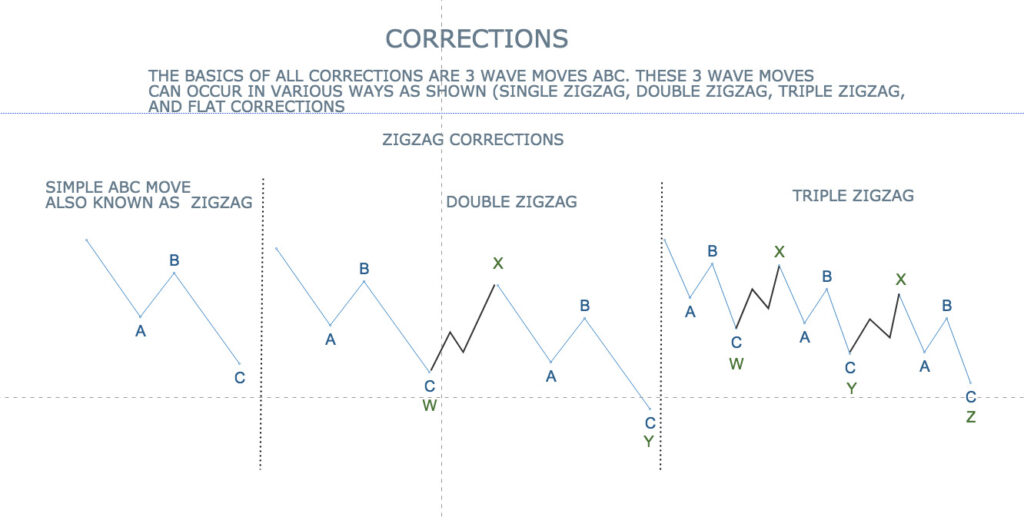
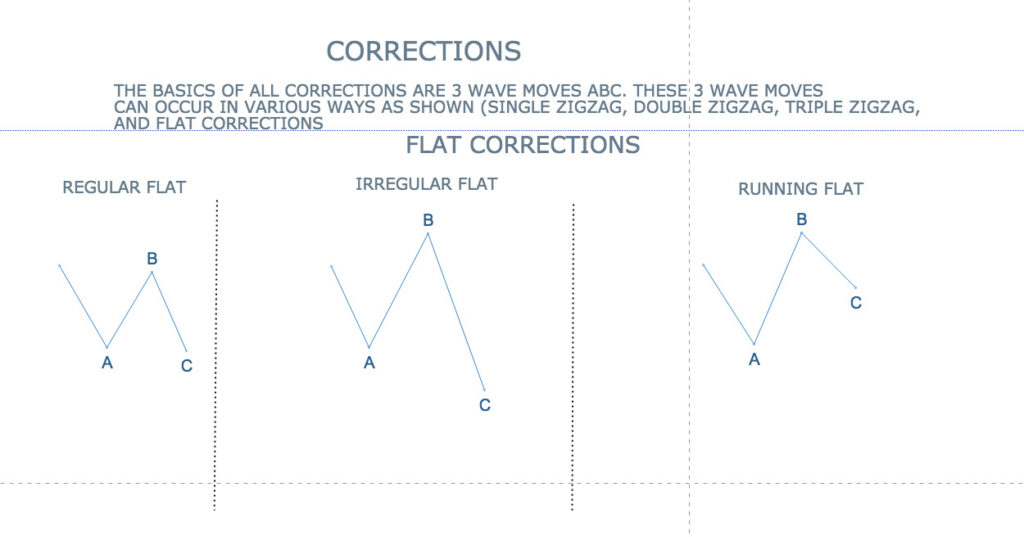
In our last update we had mentioned a medium term upswing evn to the previous high of 15473. Although the markets have sustained and risen since last week, the price action has now changed the wave count as below
The markets have most likely formed a top at 15473. Markets MAY OR MAYNOT reach that point now. In the three charts below , I have tried to give the possible route the markets may take in its correction downwards.
It must be noted that although we are calling for a eventual correction till sub 13500 levels, this correction will come with lot of upswings and will take a time period of at least 4-6 months. Once this correction is over, we MOST LIKELY will begin a multiyear Bull RUN.
As explained earlier too, your investment strategy will depend on whether you are a investor or trader(different yardsticks in investment) .
NIFTY
I am giving three charts of NIFTY below with different time cycles
NIFTY LONG TERM CHART WITH TOP IN PLACE
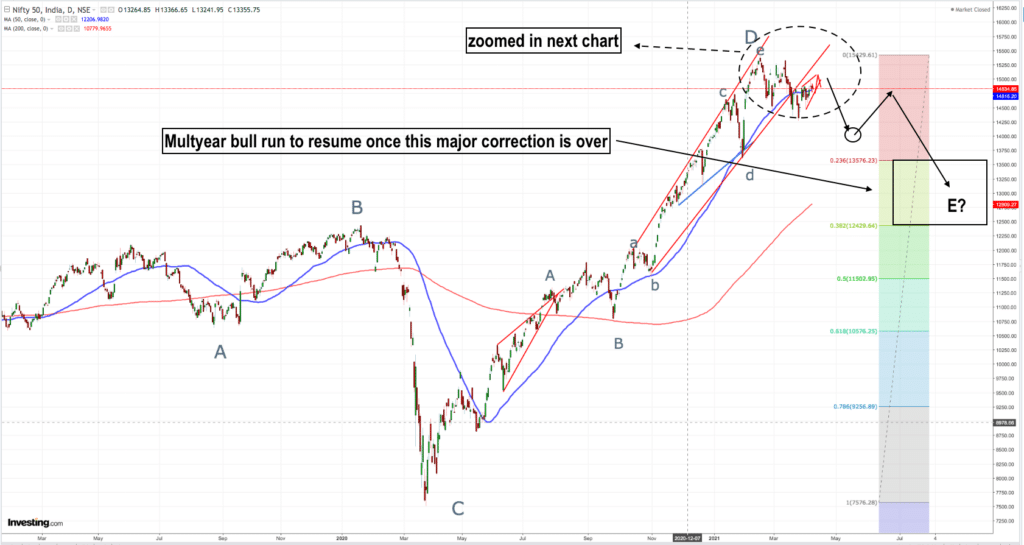
The huge COVID correction is taken as wave C of a ongoing 5 wave ABCDE correction , in which the last wave E is underway. The wave 1 of this multimonth wave E is underway or completed(it will be clear in the next one two days of trading.
IN THE SHORTER TERM HOWEVER WE MAY SEE an upswing as shown below
NIFTY MEDIUM /SHORT TERM CHART
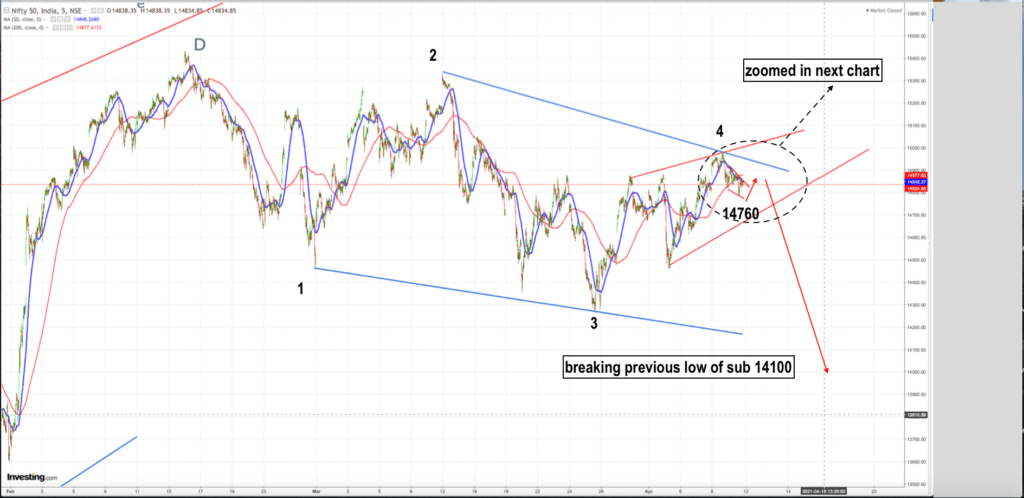
As shown above the markets MAY get an upswing on monday/tuesday which may not sustain for long.(shown by red arrows)
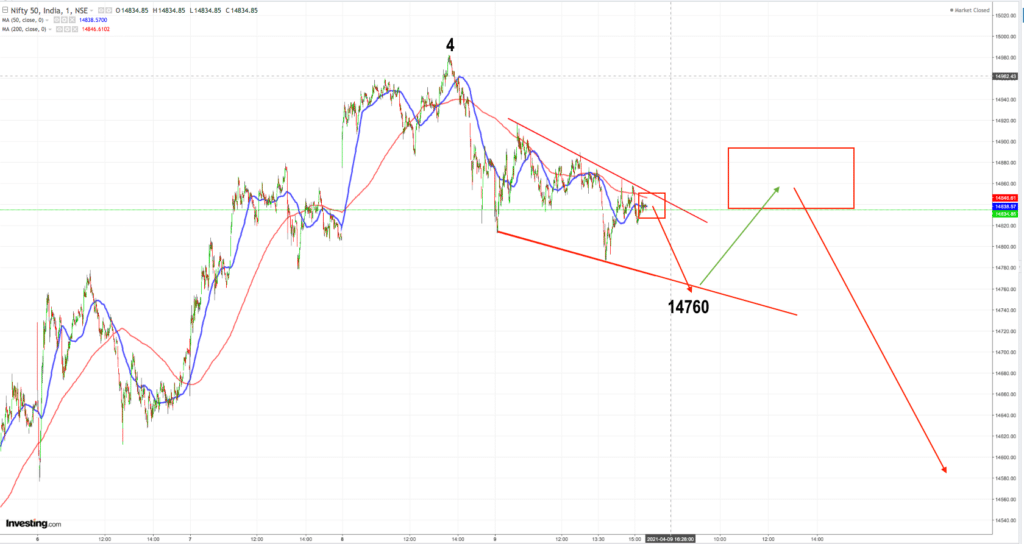
This is more clearly shown in the further zoomed chart below
NIFTY SHORT TERM CHART
DOW JONES INDUSTRIAL AVERAGE
In my last analysis I had pointed out two things.
1. The dow jones is on its last leg of the huge expanded triangle
2. In this last leg it will go higher another 4 percent or so.
For sake of clarity i am giving the monthly long term chart again showing all 5 legs of the expanded triangle.
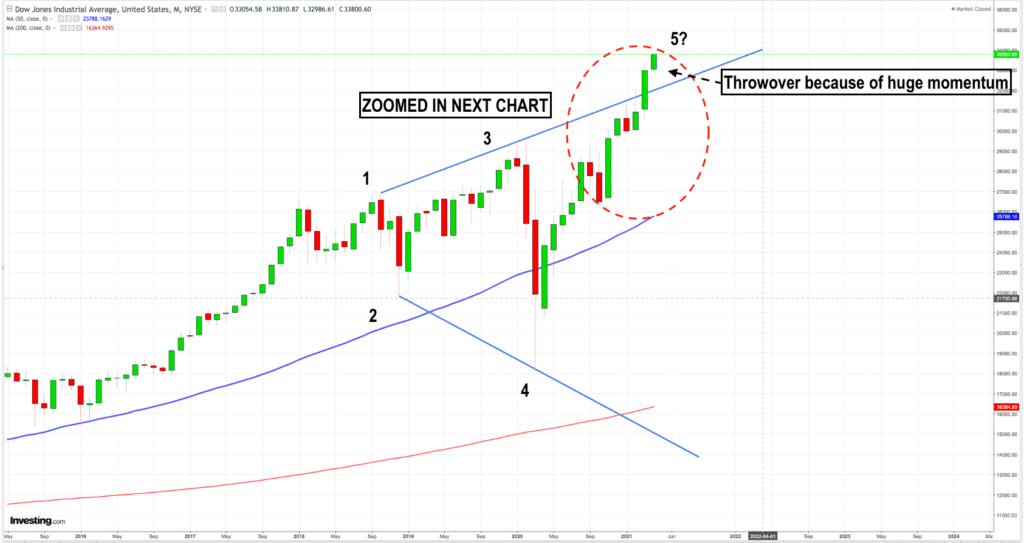
Please find below the zoomed last leg of the expanded triangle.
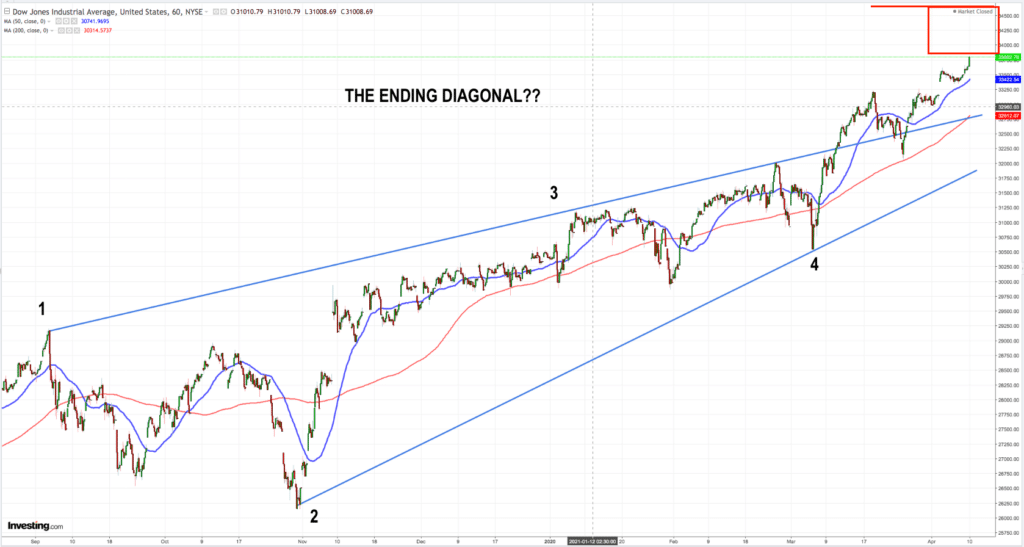
I have drawn a red rectangle for showing the last bit of POSSIBLE UPSIDE RANGE
NASDAQ
Nasdaq is showing very strong signs of revival and pending upside. This may be a huge upside (Melt up??) in the making at least for now
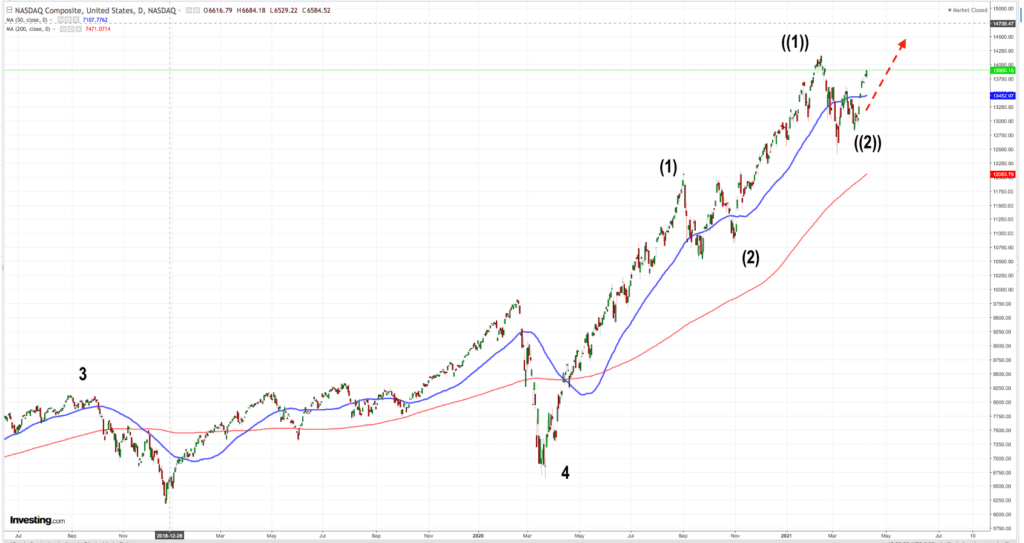
Nasdaq is showing positive signs of going much more on the upside. Dowjones showing a contrasting view point. By next week things will be more clear.
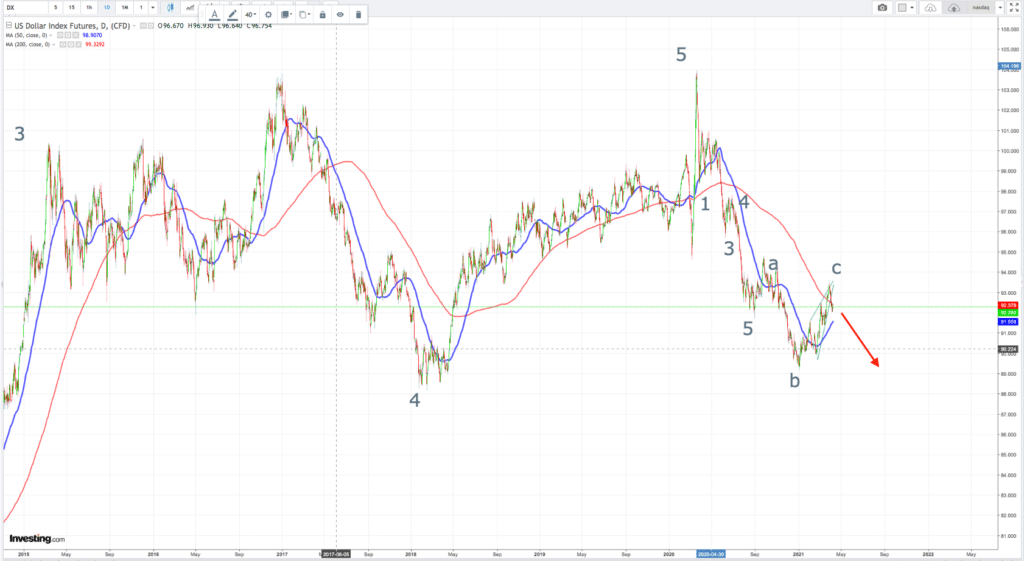
US DOLLAR INDEX
This is now consistently showing weakness and will in all likelihood fall further.
USD/INR
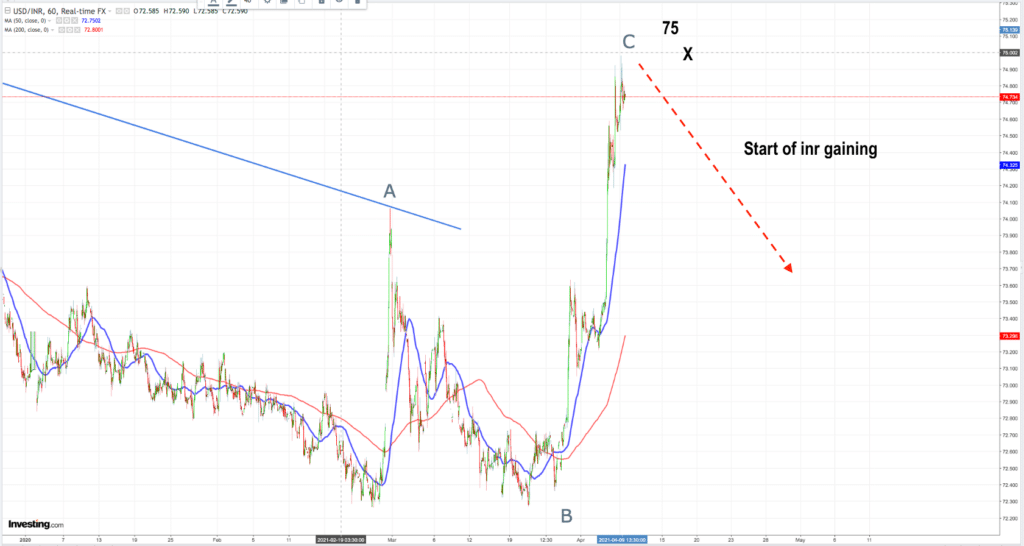
The INR has fallen in last few days abruptly against the USD. It is my contention that the fall is now over OR nearly over and the inr will start gaining from here.
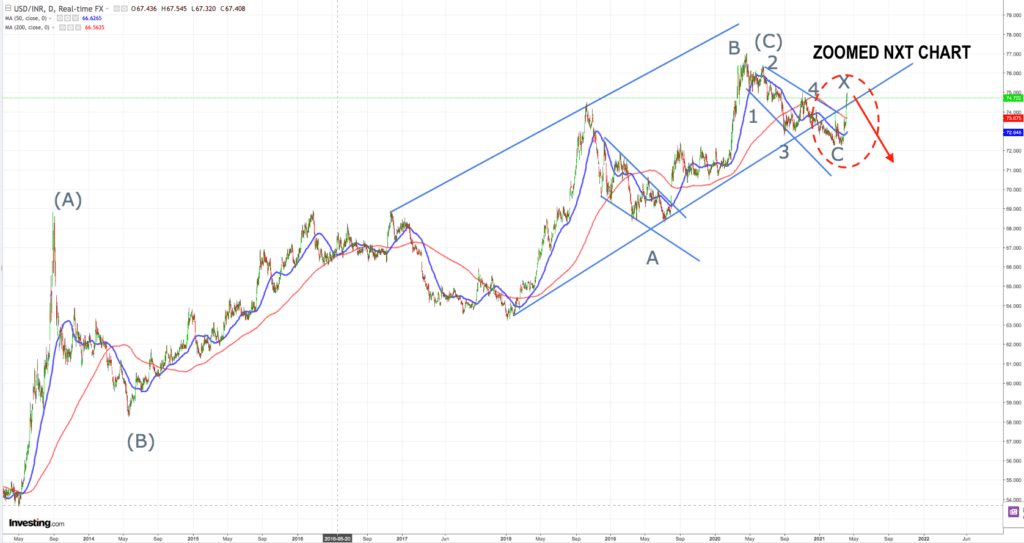
please see the zoomed chart below
Standard Disclaimer– All views expressed above are for educational purpose of the elliot wave theory. Above must not be used to do trading or investing.