NIFTY Opening On 1st June 2023
NIFTY Opening On 1st June 2023
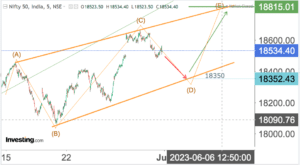
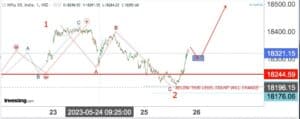
Markets behaving on predicted lines . Yesterdays fall seen as part of the 'D' leg of the ongoing finishing triangle as shown above.The D leg should finish around end of…
Markets behaving on predicted lines . Yesterdays fall seen as part of the 'D' leg of the ongoing finishing triangle as shown above.The D leg should finish around end of…
Markets are clearly overbought on almost all indicators.Markets are clearly overbought on almost all indicators. On the wave count I have drawn a POSSIBLE expanded triangle in the making where…
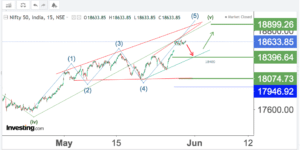
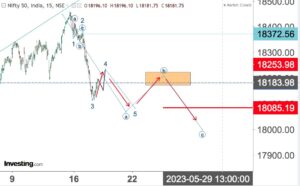
Nifty is now near completion of the impulse wave which commenced around the 20th of March. Presently it needs to complete the ongoing triangle which it should do by FIRST…
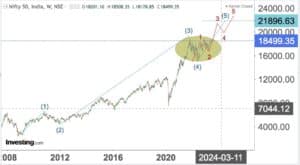
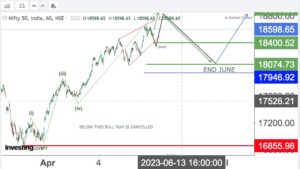
I have given three charts in succession in larger to smaller time frame in context. The 3 charts give in detail my views on developing bull market in the LARGER…
Yesterday I had mentioned two aspects of my current analysis1. We are in a bull run2. The correction will take the shape of EITHER a single zigzag or a triple…
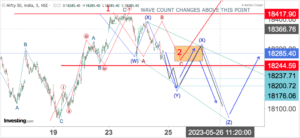
I have given two alternate counts above , in red and blue. Both have equal weightage and both are bullish in the long term , but presently IN CORRECTION.THE RED…
Most likely , the current previous upmove was an X wave (instead of a simple B wave. ) The downward move should then be a continuation of the correction and…
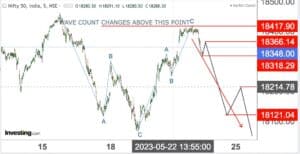
I had mentioned yesterday a distinct possibility of an X wave forming. "X" waves as mentioned earlier are "interrupters" of a larger progression in the opposite direction. Larger the size…
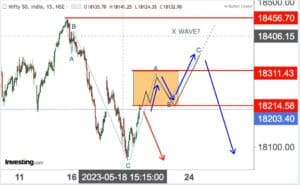
The markets went up exactly as predicted. This upward correction to THE DOWNWARD TREND MAY OR MAYNOT yet be completed . We EITHER have the abc correction already completed ,…
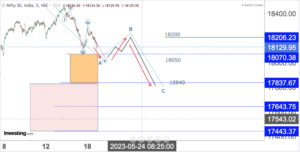
The trend is down , though markets MAY move sideways today. An upward pullback can happen once the markets touch 18050 or so. Presently the full fall looks like a…
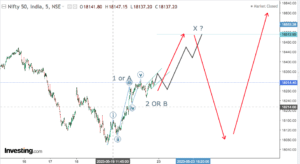
A pull back is expected which may not last for too long. We should get into the falling mode once again either by this afternoon or tomorrow. Today is clearing…
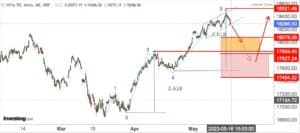
Today's NIFTY ANALYSIS. Both the 3rd wave and the 5th wave have extended which shows a PROBABLE STRONG BULL RUN. However WITHIN this bull run the markets should correct the…