What is Stock Market Analysis?
Stock market analysis is the process of evaluating the performance of a company’s stock over a period of time. It involves analyzing the financial statements and other data to identify trends and assess the financial health of a company.
What are the Different Tools Used?
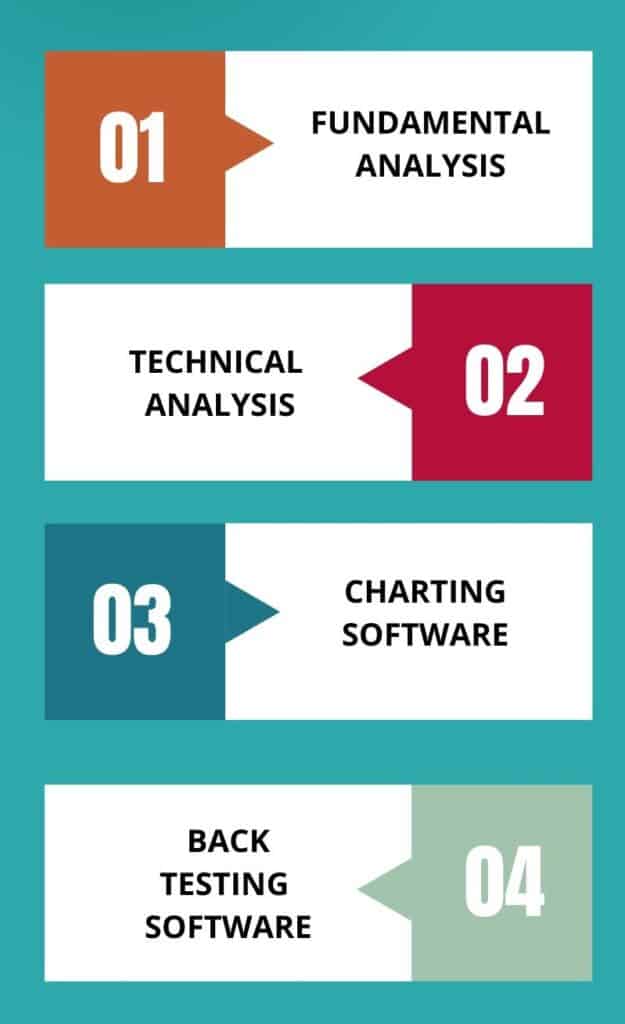
Stock market analysis can be done manually or with the help of various tools. Some tools used in stock market analysis include
- Fundamental analysis,
- Technical analysis
- Charting software
- Back testing software
Fundamental Analysis
Technical Analysis
Technical analysis, with the help of charting software, uses past price movements to predict future trends. No analysis is complete by itself and cannot be relied upon solely in isolation. However a combination of various tools available can give one a very formidable way forward for both investment and trading.
Elliot Wave Analysis

To understand the Elliot Wave theory in its entirety, it is important to understand the important parts which together constitute this theory. I am enumerating these parts below and WILL explain each part separately
- The basic structure of Elliot waves.
- Fractal Nature in the Wave Theory
- Fibonacci ratios used in Elliot wave theory and analysis
- Use of other tools in Elliot Wave Analysis.
The Basic Structure of Eliot Waves
Elliot Wave Analysis is based on the principle that prices move in waves, which are made up of smaller waves or sub-waves. The basic structure of Elliot Wave Analysis involves five distinct waves which are labeled as impulse waves, and corrective waves. These patterns can be used to identify possible entry points into a trade as well as potential price targets. By understanding and recognizing these price movements, traders can gain an edge in the markets and increase their chances of success.
The market moves in a five-wave cycle, with three waves up and two waves down.
Impulsive Waves
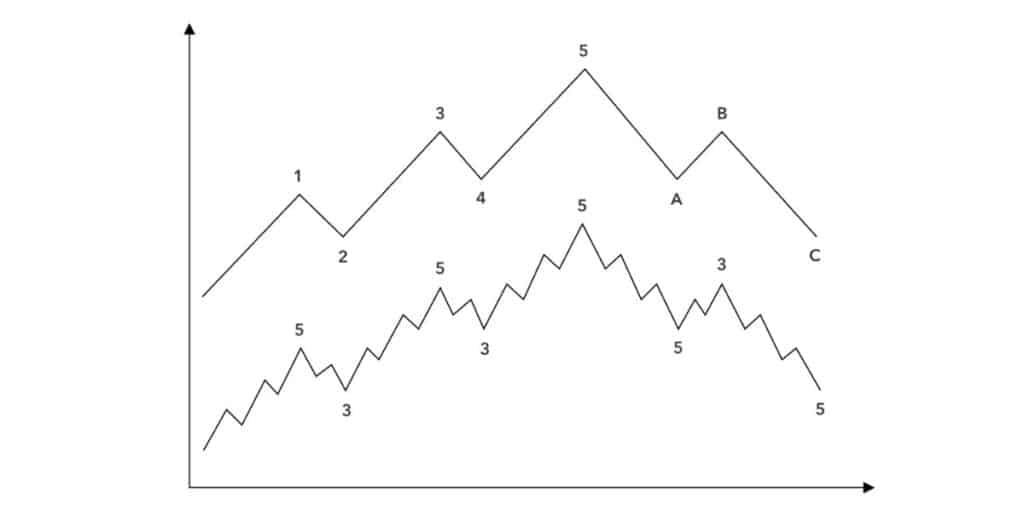
Corrective Waves Moev in Three Waevs ABC
Corrective waves, also known as “ABC” waves, are a type of wave pattern that helps traders identifies trends in the financial markets. These waves move in three distinct stages – A, B and C.
Stage A is the initial impulse wave which sets the foundation for the rest of the trend. Stage B is a corrective wave which retraces part of stage A and moves in a different direction from it.
Stage C is another impulse wave which completes the trend by continuing in the same direction as stage A.
FRACTALS IN ELLIOT WAVE ANALYSIS
To understand the fractals easily, let us assume any pattern of 1 inch in length. If it is seen in a microscope and magnified 500 hundred times, then one will see the same pattern repeated 500 times. (OR there are similar patterns WITHIN PATTERNS.
In Elliott Wave Theory, this concept of fractals is applied to price patterns. Each wave is composed of smaller sub-waves, and those sub-waves, in turn, can be further broken down into even smaller sub-waves
IN OTHER WORDS, fractals are mathematical patterns that exhibit self similarity. Same pattern is repeated in different levels of magnification. This self similar structure can be observed across different time frames, from large degree waves spanning years to smaller degree waves within a single trading day.
That is one reason, why learning Elliot wave analysis or wave counting is best done ON A SMALLER TIME FRAME OF 1 MINUTE CHART. In this within one day you can actually see all the patterns, waves which you will see on a larger time frame of many years.
Fractals also play a very practical role in determining the time duration of each wave. By observing wave patterns over smaller period, and the time taken to complete them, similar timing RATIOS can be expected over LARGER RANGES.
Fibbonacci Ratios Used For Technical Analysis In Elliot Wave Theory.
Fibonacci ratios are used extensively in Elliot wave theory. It will be fair to say that the theory itself is so dependent on the ratios that without them the whole concept of the wave theory would be junked. The similar patterns do repeat but their length and duration. are determined by these ratios. For example wave 3 and wave 5 have a direct FIBBONACCI ratio with wave 1.
Now a little about the mathematical aspect of these ratios.
However farfetched it may seem that the bulls and bears behave according to some mathematical ratios, the fact remains that patterns length and duration are governed by these ratios most of the time is true to a large extent.
Now a little academic view on Fibonacci ratios.
Fibonacci sequence is a mathematical pattern where each number is the sum of the two preceding ones, starting from 0 and 1
The first 10 numbers of the Fibonacci sequence are 0,1,1,2,3,5,8,13,21 and 34..
Interestingly these numbers and ratios have been found in various patterns and ratios in nature too!
The most commonly used Fibonacci ratios in trading are 0.382, 0.500, 0.618, 0.786, and 1.618.
Other Technical Tools Used In Technical Analysis.
There are literally hundreds of technical Indicators used in analysis. With the advent of software, these indictors are now available to everyone at the click of a button. However the danger of using too many indicators is apparent with the fact they at times they MAY give similar results but at other times will have opposing views altogether.
I am giving below few which are MORE popular. How and when to use and how to combine with the wave theory can be learnt only through tutorship.
I am listing below some of the popular indicators and oscillators.
- RSI or the Relative Strength Index
- MACD (Moving Average Convergence Divergence)
The Relative Strength Index (RSI): Understanding the RSI Indicator & How it analyzes the Stock Market
The Relative Strength Index is a momentum indicator OR HOW FAST IT IS RISING OR FALLING in relation to the previous rise and fall The Relative Strength Index (RSI) measures the velocity and magnitude of price movements. It is calculated by taking the ratio of the number of days that a security’s price closes up over a certain period to the number of days it closes down. In case the rate of rise is slower than before RSI will indicate the same in what is called DIVERGENCE.
Divergence In Relative Strength Index
MACD
Moving Average
It is nothing but averaging out the values over a specific period of time. To calculate a simple moving average over a period of let us say 5 days, you add up the closing price of the last 5 days and divide by five. On the 6th day you simply miss out the 1st day and again get the 5 day average by dividing the LAST 5 DAYS CLOSING PRICE by 5. In this way you move forward(moving average). Similarly one can calculate the 10 day, 15 day, 30 day etc moving average.
Now MACD is nothing but using two moving averages on a single chart at the same time. The first moving average OR the MACD line is derived by calculating a longer term moving average and a shorter term moving average and finding the difference between the two. Then a signal line is calculated by finding a shorter term moving average.
Now the interpretation of the macd is very mechanical. When the MACD LINE crosses above the signal line , it is taken as a bullish signal and when the MACD line crosses below the signal line, it is taken as a bearish signal.
Limitations Of MACD
- It is good only in trending markets as in sideways market the stoploss will be hit multiple times.
As mentioned before, the list of indicators is endless and I have just mentioned few above as examples. This was just an introduction to the world of technical analysis and not a training stint. It is important to understand that whichever technical indicator you may use, experience and mentorship from an experienced trader in using same is a must.